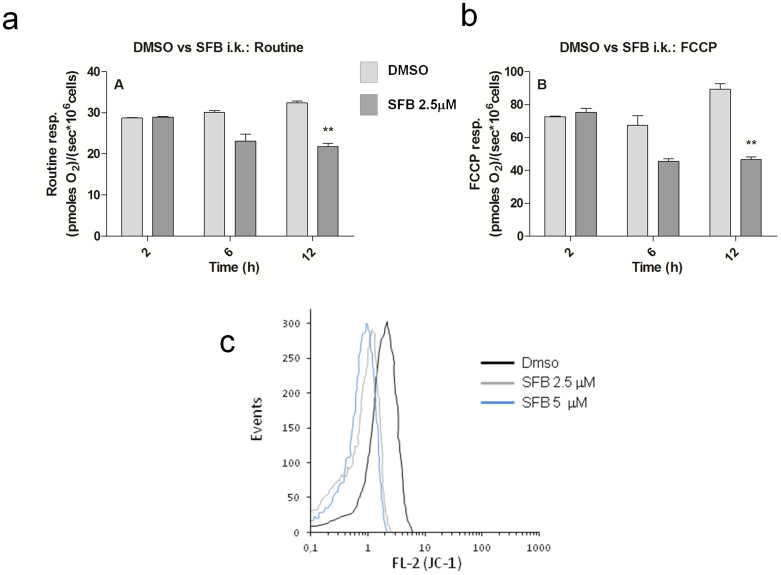
Figure 2. Sorafenib inhibits cellular respiration and depolarizes isolated mitochondria.
(a) and (b). Respirometric Analysis of LCSC-2 cells exposed for 2, 6 and 12 hours to 2.5 μM SFB or Dmso as vehicle control. The two histograms illustrate the inhibitory effect of the drug on Routine Respiration (A), and uncoupled respiration (B) (see methods for experimental details). Asterisks denote statistical significance (two-tailed Student t-test, compared to untreated control). (c). Flow cytometry analysis of mitochondrial staining with the potentiometric dye JC-1. Decreased red (FL-2) fluorescence of mitochondria exposed to SFB indicates loss of trans-membrane potential (ψ). Plot representative of two independent experiments.

