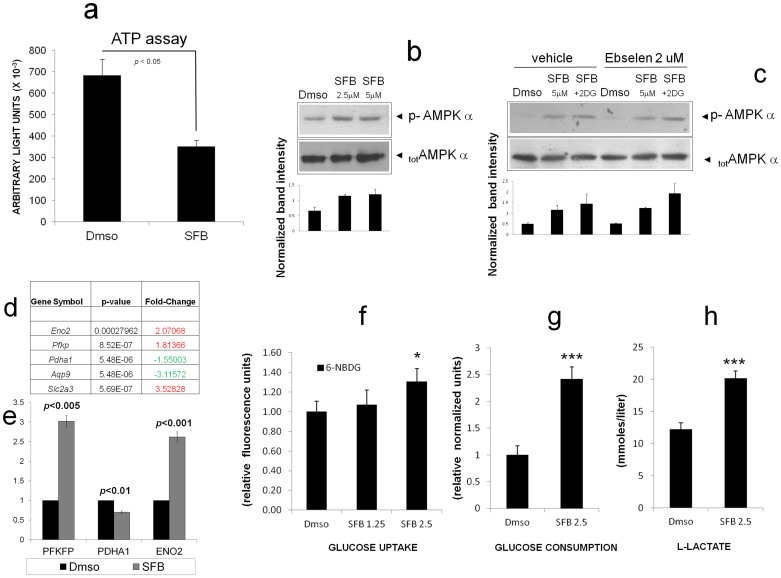
Figure 3. Sorafenib modulates energy metabolism.
(a). ATP measurement in LCSC-2 cells treated with SFB. Values are in light units normalized for protein content. Bars are Mean ± SD of duplicate sample. Statistics are by two-tailed t-test. Histogram representative of two independent experiments. (b). Immunodetection of phospho-(Thr 172) AMPK phosphorylation under the indicated stimuli; anti AMPK (total) immunoblotting was used as loading control. (c). Anti p-AMPK immunoblot showing no inhibitory effect of Ebselen on AMPK phosphorylation by SFB or SFB + 2DG. Total AMPK was used as loading control. Relevant bands are indicated by arrows. Picture representative of at least two independent experiments. Black colums are Mean ± SD of densitometric values from 2–3 independent experiments, normalized for average band indesity. (d). Glycolysis-related genes modulated by Sorafenib in LCSC-2 cells. Fold change refers to the untreated (Dmso) sample. Upregulated genes are highlighted in red, downregulated genes in green. (e). Real Time PCR validation of three selected genes from panel C, a. Fold change (SFB/Dmso) for each gene was calculated by the ΔCt method (see Supplementary Methods); bars are mean ± SD of three independent reactions. Statistics are by two-tailed t-test. (f), (g) and (h). Bar graphs displaying enhanced 6NBDG uptake and increased glucose metabolism in LCSC-2 cells after 48 hours exposure to SFB. Bars are Mean SD of 2–3 independent samples. * p < 0.05 (ANOVA); *** p < 0.0001 (t-test).

