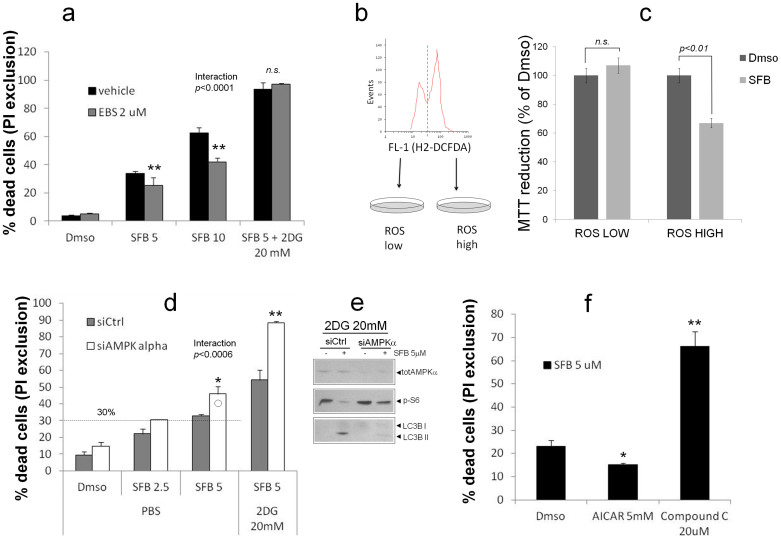
Figure 6. LCSC-2 cell killing by SFB involves ROS and is counteracted by AMPK.
(a) PI exclusion assay depicting the effect of Ebselen (2 μM, gray bars) on LCSC-2 cell growth inhibition by SFB and SFB + 2DG. Bars are mean ± SD of duplicate or triplicate samples. Statistics are by two-way ANOVA. ** p < 0.01 compared to vehicle. Significance for the interaction SFBxEBS is also indicated. Representative of two independent experiments. (b). Identification and sorting of LCSC-2 cell populations with low and high content of ROS, based on H2-DCFDA fluorescence distribution on green fluorescence FL-1 histogram. (c). growth inhibition evaluated by MTT assay. Values are percentages of Dmso/PBS. Bars are mean ± SD of duplicate samples. Statistics of relevant comparisons by two-way ANOVA are indicated. Significance for the interaction effect (ROS x SFB) is indicated. Picture representative of two independent experiments. (d). Knock-down of AMPKα by siRNA sensitizes LCSC-2 cells to SFB. (e). PI exclusion assay on mock (siCtrl) and AMPK-silenced (siAMPKα) LCSC-2 cells exposed to SFB alone or in combination with 2DG for 24 hours. Significant differences (AMPK versus Ctrl) are indicated by asterisks. * p < 0.05; **p < 0.01 by two-way ANOVA. Bars are mean ± SD of duplicate samples. Picture representative of two independent experiments. (e). western blot analysis confirming AMPK downregulation and impaired pS6 inhibition/LC3B lipidation in siAMPK-treated cells exposed to SFB. Representative of two independent experiments. (f). PI exclusion assay illustrating LCSC-2 sensitivity to 5 μM SFB upon pharmacological modulation of AMPKα; inhibitors were added to cells 2 hours prior to SFB, and viability was assessed 22 hour later. * p < 0.05 ** p < 0.01 by one-way ANOVA. Values are mean ± SD of duplicate samples. Picture representative of two independent experiments.

