
Figure 7.
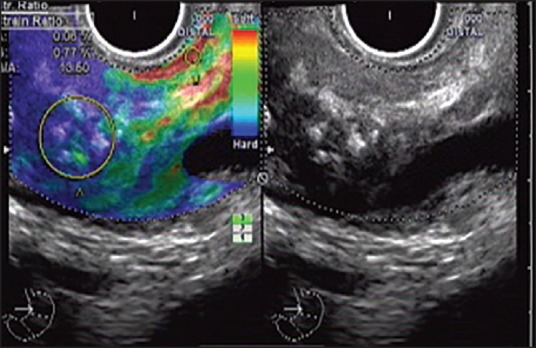
Quantitative endoscopic ultrasound (EUS) elastography and strain ratio measurement with radial echoendoscope at the body of pancreas: The EUS shows echogenic foci with shadowing (Right side). A stable EUS image for at least 5 s is obtained for EUS quantitative analysis. The region of interest for the elastographic evaluation is manually selected to include the targeted area of the pancreas (region A) and soft (red) reference area corresponding to normal gastric wall (region B). A strain ratio of 13.6 has been obtained