
Figure 7.
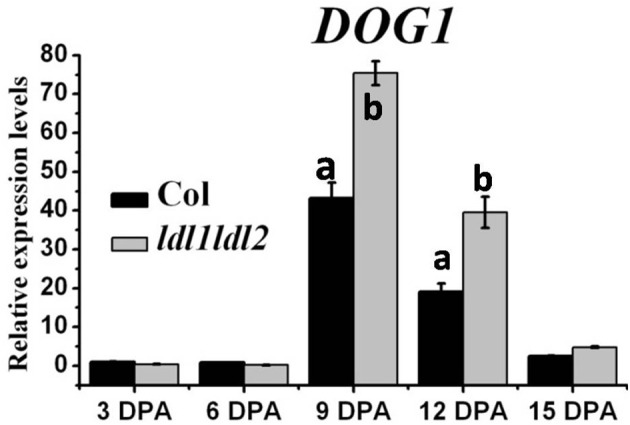
Transcription analysis of DOG1 expression in Col and ldl1 ldl2 during seed maturation. UBQ10 was used as an internal control. At least three biological replicates were conducted. The average (±SD) values are shown. One-Way ANOVA (Tukey-Kramer test) analysis was performed, and statistically significant differences (P < 0.01) were indicated by different lowercase letters (a, b). Equivalent means have the same letter; different letters indicate statistically significant differences.