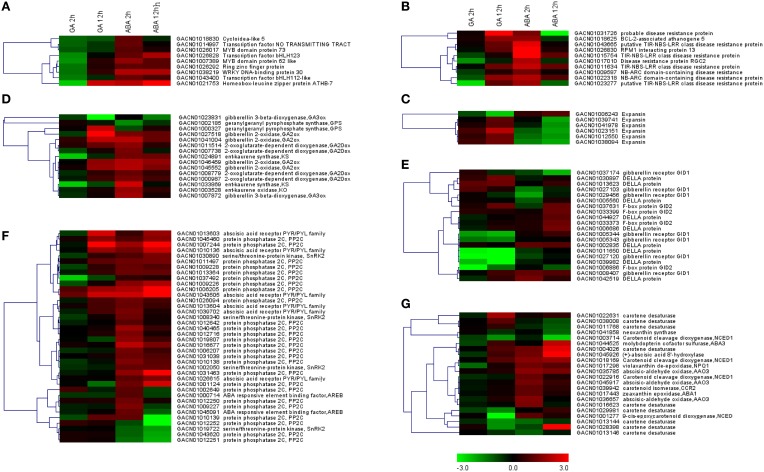
Figure 5.
Transcript profiles of genes involving in enriched GO categories or KEGG pathways. Log2-transformed fold-change values were used for clustering analysis in MeV, which represent the relative transcription level under the denoted conditions relative to the control. (A) DEGs associated with regulation of transcription. (B,C) DEGs with the GO terms of “cell death” or “cell wall organization.” (D–G) Unigenes involved in pathways related to gibberellin biosynthesis (D) or signaling (E), or ABA biosynthesis (G) or signaling (F).

