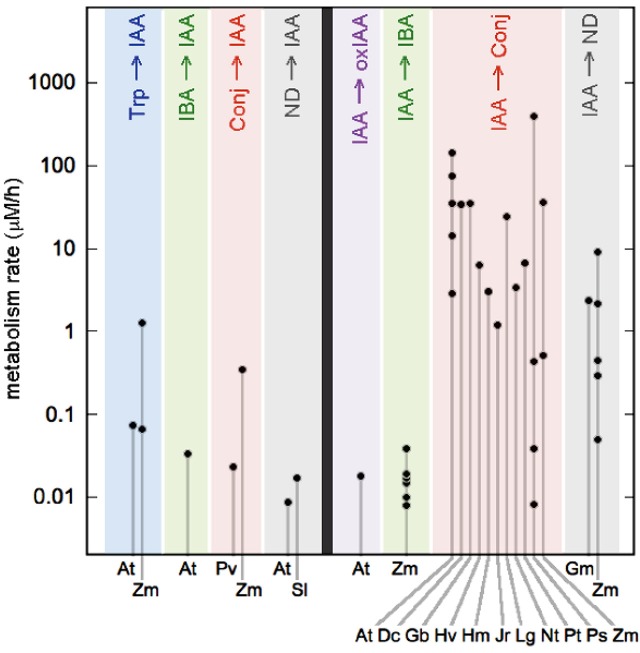
Figure 2.
Metabolic rates in seed plants. Metabolic pathways are distinguished by color and labeled at top with abbreviations introduced in Figure 1 (Conj, conjugates; ND, not determined). The left half of the figure shows metabolic pathways that add auxin to the tissue. The right half shows pathways that remove auxin. Abbreviations along the bottom indicate the various species for which data is available: At, Arabidopsis thaliana; Dc, Daucus carota; Gb, Gingko biloba; Gm, Glycine max; Hv, Hippuris vulgaris; Hm, Hyoscyamus muticus; Jr, Juglans regia; Lg, Lemna gibba; Nt, Nicotiana tabacum; Pt, Pinus thunbergiana; Ps, Pisum sativum; Pv, Phaseolus vulgaris; Sl, Solanum lycopersicum; and Zm, Zea mays. Rates are derived from published papers, as summarized in the main text and described fully in the Supplemental Information. Error bars (not shown) are ±30%.

