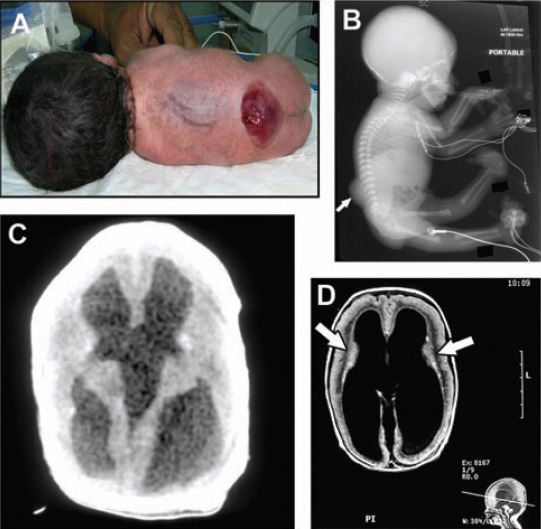
Figure 3.

Walker-Warburg Syndrome. A) Macrocephaly and lumbosacral myelomeningocele in the proband (also shown on X-ray [arrow in B]). C) Cranial CT scan of the proband showing hydrocephalus. D) Axial brain MRI of an affected sibling showing hydrocephalus, lissencephaly, and layering of the cortex (arrows). Note the pontocerebellar hypoplasia in the sagittal image below.
