Table 2.
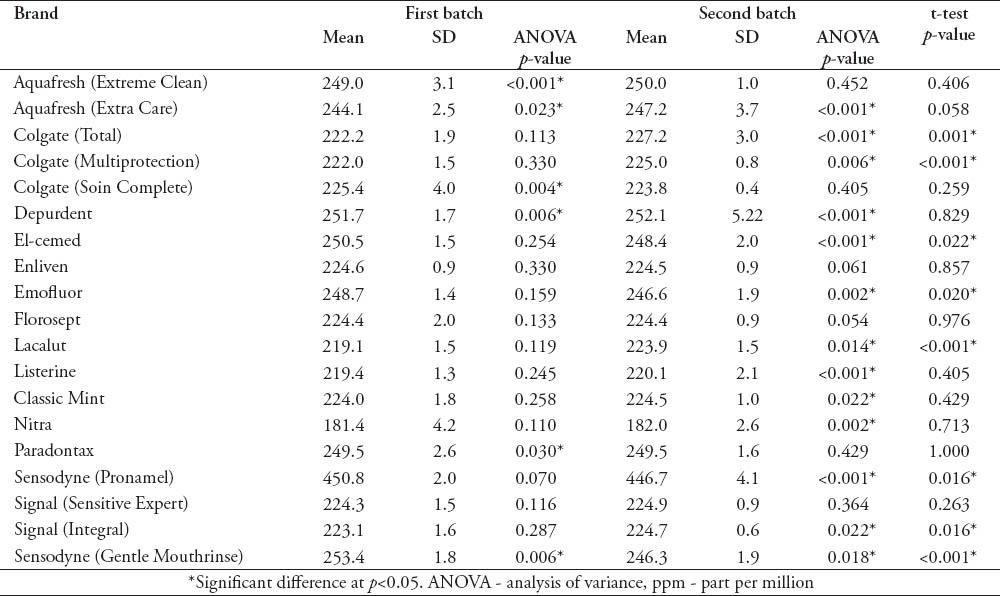
Means of the 6 samples of the 19 fluoride labeled brands in ppm, the ANOVA comparisons, and t-test comparisons of the fluoride concentration in the 2 batches.

Means of the 6 samples of the 19 fluoride labeled brands in ppm, the ANOVA comparisons, and t-test comparisons of the fluoride concentration in the 2 batches.
