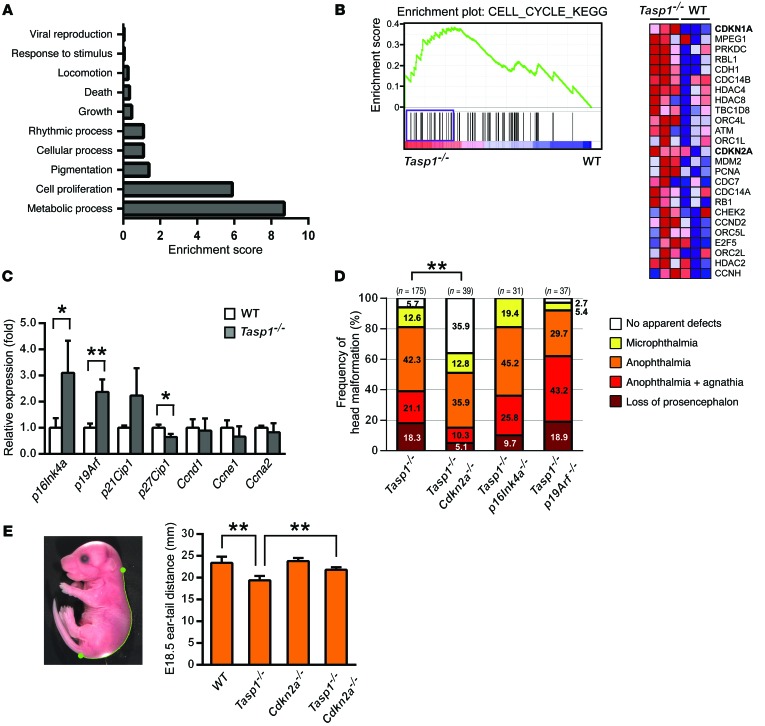
Figure 4. Craniofacial and body size anomalies of Tasp1–/– embryos are rescued by Cdkn2a deficiency.
(A) RNA harvested from E10.5 WT and Tasp1–/– heads was subjected to microarray. Gene Ontology analysis shows functional categories of differentially expressed genes in the order of the enrichment score. (B) GSEA of expression signals from WT and Tasp1–/– samples. Enrichment plot of the “CELL_CYCLE_KEGG” gene set, indicating enrichment of cell cycle–associated genes among significantly upregulated mRNAs in Tasp1–/– heads (P < 0.01, normalized enrichment scores = 1.57). Genes showing core enrichment (indicated by inclusion in the purple bar under the enrichment plot) are listed by relative expression (red, high; blue, low). (C) Increased p16Ink4a and p19Arf mRNA levels were detected in E10.5 Tasp1–/– embryonic heads by quantitative RT-PCR (n = 3 throughout). Error bars represent SD. *P < 0.05, **P < 0.01, unpaired 2-tailed Student’s t test. (D) Frequencies of the otocephalic phenotypes in E14.5 embryos of the indicated genotypes. Note that Cdkn2a deficiency significantly rescued Tasp1–/– craniofacial malformations. **P < 0.01, Fisher’s exact test. (E) Body sizes of E18.5 embryos of the indicated genotypes. The distance from the ears to the base of tail was measured using ImageJ analysis. Note that Cdkn2a deficiency significantly rescued the reduced body sizes of Tasp1–/– embryos (n = 4 throughout). Error bars represent SD. **P < 0.01, unpaired 2-tailed Student’s t test.

