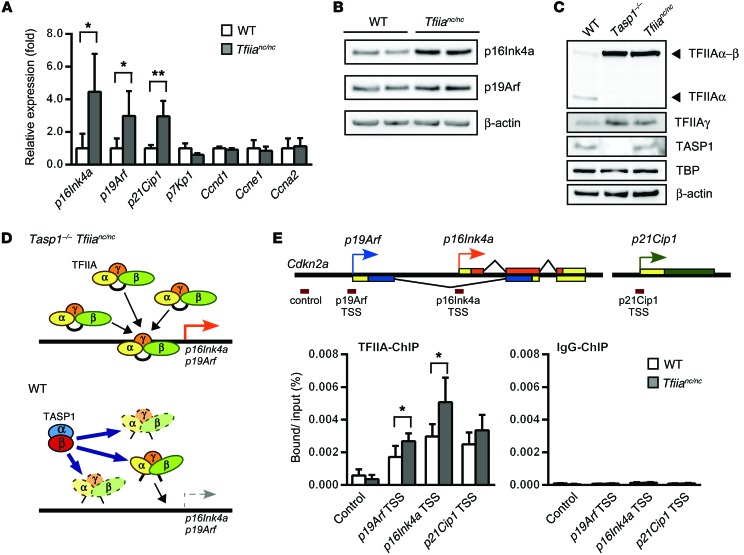
Figure 6. Loss of TFIIAα-β proteolysis leads to TFIIA stabilization at the Cdkn2a locus.
(A) Quantitative RT-PCR detected increased p16Ink4a, p19Arf, and p21Cip1 mRNA levels in Tfiianc/nc E10.5 embryo heads relative to levels in WT embryo heads. The mean was calculated from n = 3 (Tfiianc/nc) and n = 5 (WT). Error bars represent SD. *P < 0.05, **P < 0.01, unpaired 2-tailed Student’s t test. (B) Immunoblots of WT and Tfiianc/nc MEFs validated increased levels of p16Ink4a and p19Arf proteins in Tfiianc/nc cells. (C) Immunoblots showing levels of TFIIAα, TFIIAα-β, TFIIAγ, TASP1, TBP, and β-actin in WT, Tasp1–/–, and Tfiianc/nc E10.5 embryo heads. Note the accumulation of TFIIAα-β in the Tasp1–/– and Tfiianc/nc lysates. (D) Illustration depicting the role of TFIIA in p16Ink4a and p19Arf regulation. During craniofacial development, TASP1-mediated cleavage of TFIIAα-β promotes TFIIA degradation, resulting in limited p16Ink4a and p19Arf transcription. (E) ChIP assay detected an increase of TFIIA at the Cdkn2a locus of Tfiianc/nc E10.5 embryo heads relative to that in WT embryo heads. TFIIA binding relative to input was quantified as a percentage by quantitative RT-PCR targeting the p16Ink4a transcription start site (TSS), the p19Arf transcription start site, and the Cdkn2a 3-kb upstream sequence (control) (n = 4 [Tfiianc/nc]; n = 5 [WT]). Error bars represent SD. *P < 0.05, unpaired 2-tailed Student’s t test.

