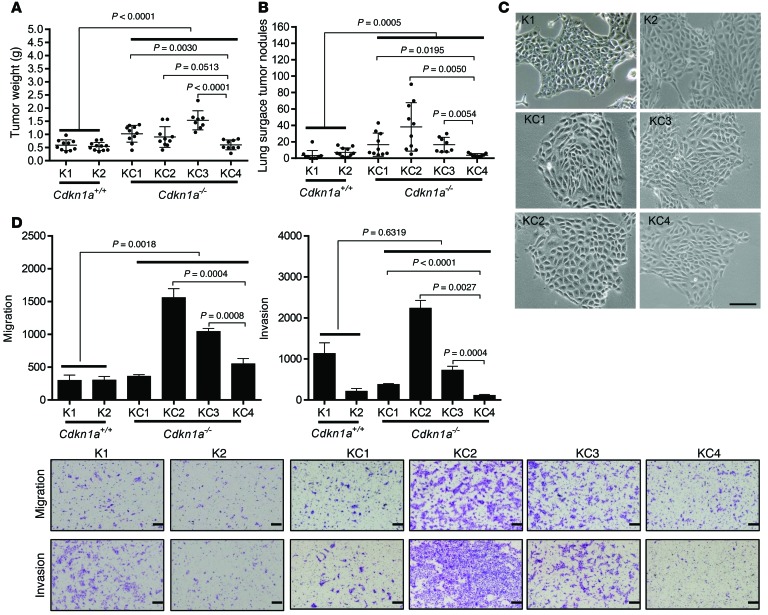
Figure 2. Characterization of p21-deficient (KC) and -replete (K) murine lung adenocarcinoma cells.
(A and B) Scatter plots of primary tumor weights (A) and total numbers of lung metastases (B). Syngeneic Cdkn1a-null mice injected subcutaneously with K and KC cells. Dot, single mouse; bars and whiskers, mean ± SD of replicate mice from a single experiment. (C) Cell morphologies in monolayer culture. (D) Images show migrating and invading cells in Boyden chambers. Scale bars: 100 μm (C) 200 μm (D). Bar graphs show mean ± SD of triplicate samples in a single experiment. P values shown in figures, 2-tailed Student’s t test. One-way ANOVA, A (P < 0.0001), B (P < 0.0001), and D (P < 0.0001).

