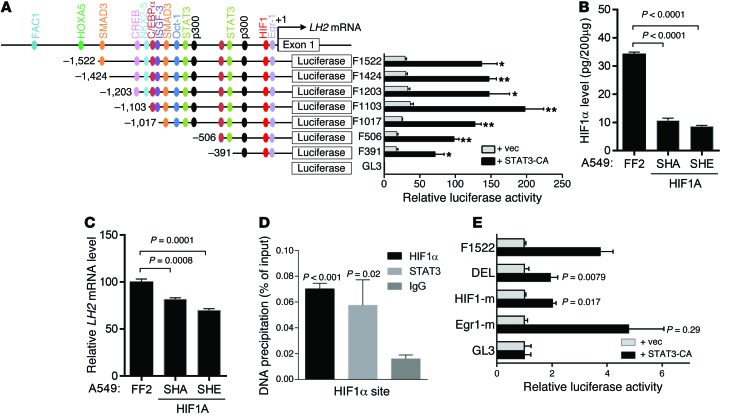
Figure 6. STAT3-induced LH2 expression is HIF-1 dependent.
(A) LH2 gene promoter fragments created by PCR contain the predicted transcription factor binding sites (color-coded) (JASPAR: http://jaspar.genereg.net/ and BIOBASE: http://www.biobase-international.com/). A549 cells transiently cotransfected with an empty (vec) or constitutively active (CA) mutant STAT3 expression vector, a Renilla luciferase reporter (for normalization), and a firefly luciferase reporter driven by LH2 promoter constructs. Firefly luciferase activities from a single experiment (bar graphs aligned with promoter constructs) expressed as mean ± SD of triplicate wells relative to the activity of the basal reporter (pGL3), which was set at 1.0. (B) HIF-1α levels determined by ELISA on A549 cell lysates stably transfected with HIF-1α or control (FF2) shRNA. Data from a single experiment are expressed as mean ± SD of triplicate samples. (C) Q-PCR analysis of LH2 expression in A549 cells stably transfected with HIF-1α shRNA (SHA or SHE) or control shRNA (FF2). Normalized Q-PCR results from a single experiment are expressed as mean ± SD of triplicate samples. (D) ChIP assay performed on A549 cell lysates using anti–HIF-1α and -STAT3 antibodies. Precipitated DNA amounts (percent of input) expressed as mean ± SD of triplicate samples from a single experiment. IgG was used as a negative control. (E) Luciferase assays performed in a single experiment on A549 cells as described in A. LH2 promoter reporter constructs contain site-directed mutations in HIF-1α (HIF-1-m) or Egr1 (Egr1-m) binding sites or deletion of both sites (DEL). P values, 2-tailed Student’s t test.

