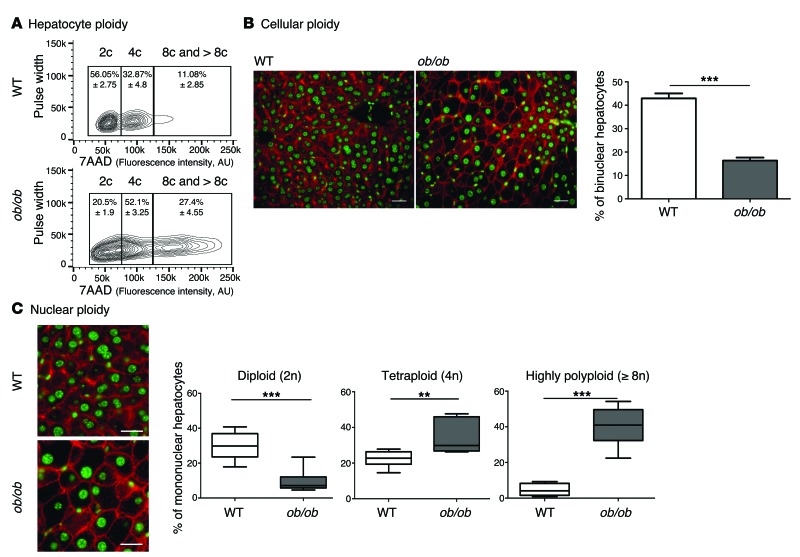
Figure 1. Hepatocyte ploidy profiles are altered in a genetic mouse model of NAFLD.
(A) Hepatocytes from WT and ob/ob livers were separated into ploidy populations by FACS analyses (n = 3 per group) with 2c, 4c, and 8c and >8c DNA content corresponding to diploid, tetraploid, and highly polyploid hepatocytes, respectively. Of note, smear between hepatocytes populations (ob/ob cells) is due to high granularity (correlation with high lipid content). 7AAD, 7-aminoactinomycin D. (B) Images of liver sections from WT and ob/ob mice after double staining with β-catenin (plasma membrane labeling, red) and Hoechst (nucleus, green) (scale bar: 20 μm). Percentage of binuclear hepatocytes in WT and ob/ob mice (n = 6 per group). Results represent mean ± SEM. ***P < 0.001, Student’s t test. (C) β-Catenin/Hoechst immunostaining in WT and ob/ob mice (scale bar: 20 μm) and box plots of the percentage of 2n, 4n, and ≥8n mononuclear hepatocytes relative to total hepatocytes in WT and ob/ob mice. The bottom, central, and top lines of each box represent the first quartile, median, and third quartile of the distribution, respectively (n = 6 per group). **P < 0.005, ***P < 0.001, Student’s t test.

