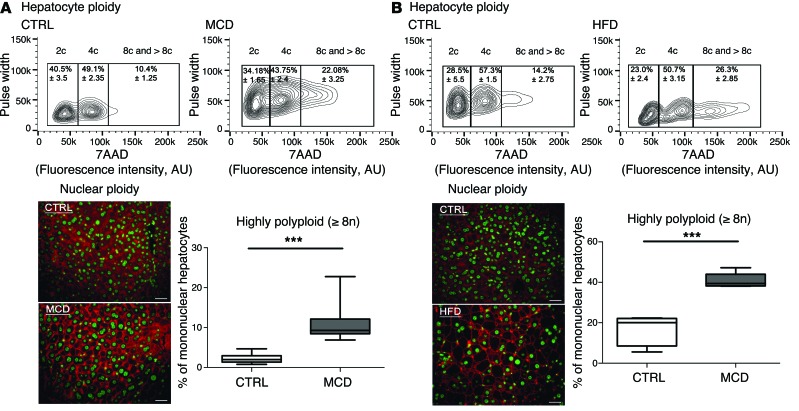
Figure 2. Hepatocyte ploidy profiles are altered in dietary mouse models of NAFLD.
(A) MCD diet model. Hepatocytes were separated into ploidy populations by FACS analysis (n = 3 per group) with 2c, 4c, and 8c and >8c DNA content corresponding to diploid, tetraploid, and highly polyploid hepatocytes, respectively. Images of liver sections after double staining with anti–β-catenin (plasma membrane labeling, red) and Hoechst (nucleus, green) in WT mice fed control (CTRL) or MCD diets (scale bar: 20 μm). Box plots of the percentage of ≥8n mononuclear hepatocytes relative to total hepatocytes in control-fed and MCD diet–fed mice. Results represent mean ± SEM (n = 8 per group). ***P < 0.001, Student’s t test. (B) HFD model. Hepatocytes were separated into ploidy populations by FACS analysis (n = 3 per group) with 2c, 4c, and 8c and >8c DNA content corresponding to diploid, tetraploid, and highly polyploid hepatocytes, respectively. Images of liver sections after double staining with anti–β-catenin (red) and Hoechst (green) in WT mice fed a control or a HFD (scale bar: 20 μm). Box plots of the percentage of ≥8n mononuclear hepatocytes relative to total hepatocytes in control-fed and HFD-fed mice. Results represent mean ± SEM (n = 5 per group). ***P < 0.001, Student’s t test.

