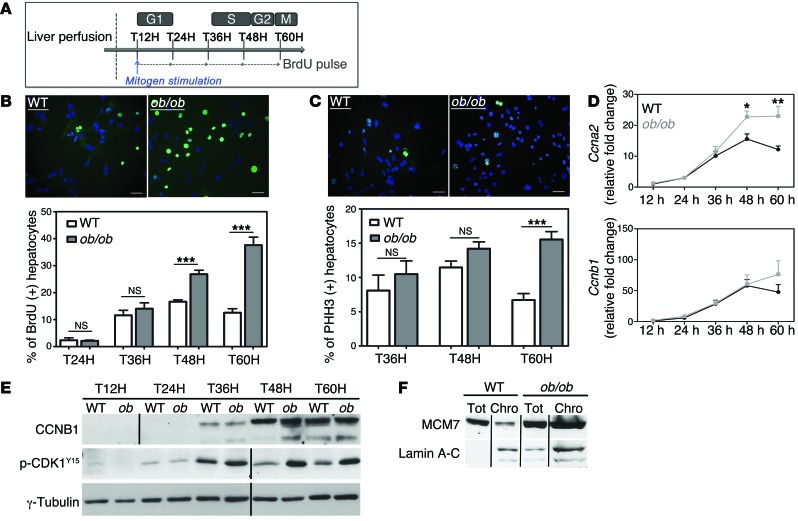
Figure 4. NAFLD hepatocytes preferentially undergo an altered cell cycle.
Experiments were carried out in hepatocytes isolated from WT or ob/ob livers (4 independent cultures). (A) Experimental scheme of culture. T12H, time 12 hours after plating. (B) Immunostaining of primary hepatocytes with anti-BrdU (green) and Hoechst (blue) at 60 hours after plating (scale bar: 20 μm) and quantitative analysis of BrdU labeling (percentage of BrdU+ hepatocytes). Data represent the mean ± SEM. ***P < 0.001, Student’s t test. (C) Double immunostaining of primary hepatocytes at 60 hours after plating, with anti-PHH3 (green) and Hoechst (blue) (scale bar: 20 μm) and quantitative analysis of G2-labeling index (percentage of PHH3+ nuclei). Data represent mean ± SEM. ***P < 0.001, Student’s t test. (D) RNA extracted from WT (black circle) and ob/ob (gray square) primary hepatocytes (n = 5) and Ccna2 and Ccnb1 mRNAs were analyzed by quantitative real-time PCR. *P < 0.05, **P < 0.01, Student’s t test. (E) CCNB1 and phosphorylated CDK1 (Tyr15) protein levels were analyzed in WT and ob/ob cultures during the time-course experiment. γ-Tubulin was used as a loading control. The CCNB1 blot was derived from parallel samples run on a separate gel. The Western blot is from the same experiment as the Figure 6 and Supplemental Figure 4 and is representative of 4 different cultures. Lanes were run on the same gel but were noncontiguous, as indicated by the black line. (F) Soluble chromatin was prepared from culture at 60 hours, and MCM7 was analyzed by Western blotting. Lamin A-C was used as an indicator of fraction purity. Tot, total fraction; Chro, chromatin fraction. The Western blot is representative of 4 different cultures. Lanes were run on the same gel but were noncontiguous.

