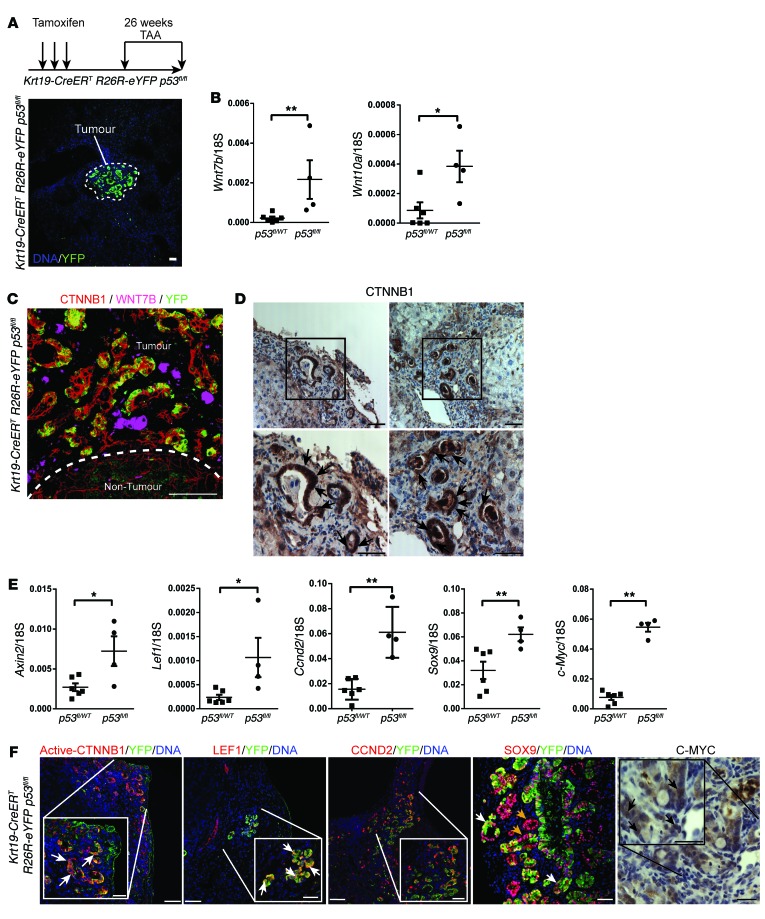
Figure 2. Transgenic induction of TAA in mouse has an activated WNT pathway.
(A) Schematic showing strategy for generating CC using Krt19-CreERT R26R-eYFP p53fl/fl mice. (B) Wnt7b and Wnt10a mRNA expression in Krt19-CreERT R26R-eYFP p53fl/WT or Krt19-CreERT R26R-eYFP p53WT/WT versus Krt19-CreERT R26R-eYFP p53fl/fl mice (n = 6 vs. n = 4). (C) Immunohistochemistry for CTNNB1 (red), WNT7B (pink), and YFP (green) in Krt19-CreERT R26R-eYFP p53fl/fl mice. Dotted line, the tumor—non-tumor interface. (D) Immunohistochemistry for CTNNB1. Boxes, regions that are magnified in the images below; black arrows, strong nuclear staining. (E) mRNA expression of Axin2, Lef1, Ccnd2, Sox9, and c-Myc in Krt19-CreERT R26R-eYFP p53fl/+ or Krt19-CreERT R26R-eYFP p53+/+ versus Krt19-CreERT R26R-eYFP p53fl/fl mice (n = 6 vs. n = 4). (F) Immunohistochemistry in Krt19-CreERT R26R-eYFP p53fl/fl tumors for active (dephosphorylated) CTNNB1, LEF1, CCND2, or SOX9 (red), and YFP (green) or C-MYC (brown). Data are presented as mean ± SEM. Mann-Whitney U test; *P < 0.05, **P < 0.01. Photomicrograph scale bars: 50 μm; insets, 10 μm.

