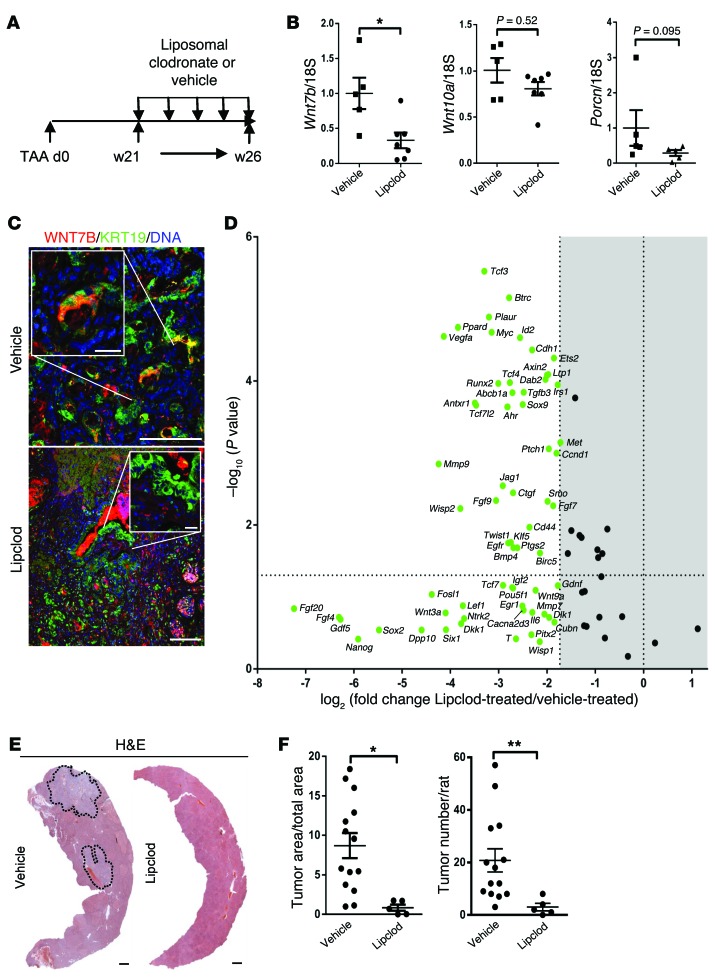
Figure 6. Macrophage inhibition reduces CC growth in vivo.
(A) Schematic representing macrophage depletion in TAA using Lipclod. (B) mRNA expression of Wnt7b, Wnt10a, and Porcn following macrophage depletion in TAA CC using vehicle versus Lipclod (n = 5 vs. n = 7). (C) Immunohistochemistry on vehicle- versus Lipclod-treated TAA tissue for WNT7B (red) and KRT19 (green). (D) mRNA expression of WNT pathway target genes following Lipclod depletion of macrophages (n = 6 per group); green denotes downregulation. Represented as a 3-fold change; P < 0.05 (E) H&E of rat liver from TAA rats treated with vehicle versus Lipclod. (F) Quantification of area and number of rat TAA-induced CC tumors following treatment with vehicle or Lipclod (n = 14 vs. n = 5). Data are represented as mean ± SEM. Mann-Whitney U test; *P < 0.05, **P < 0.01. Scale bars in C: 50 μm; insets, 10 μm. Scale bars in E: 1 mm.

