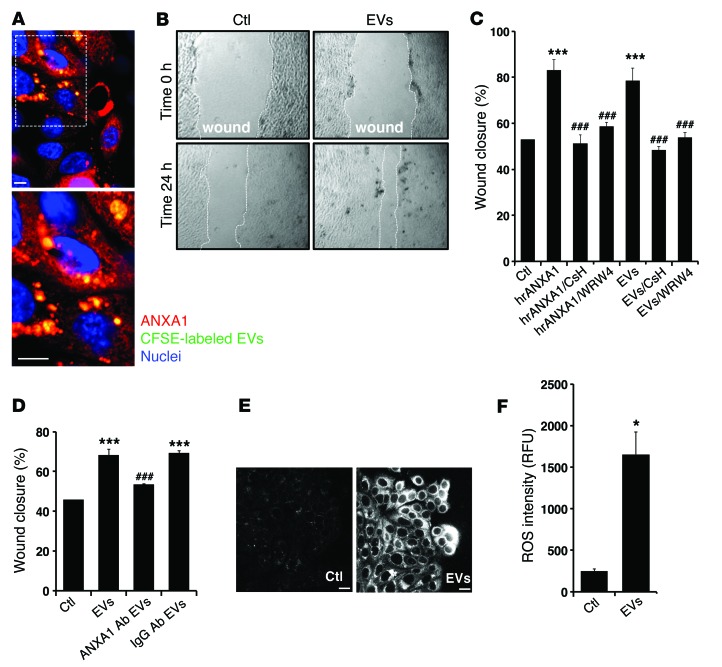
Figure 2. EVs containing ANXA1 regulate epithelial wound healing.
(A) Representative (of n = 5) en face image of migrating IECs after 24 hours of interaction with labeled EVs (CFSE, 10 μmol/l; Molecular Probes). The boxed area (original magnification, ×40) is shown at high magnification in the image below (original magnification, ×100). Scale bar: 10 μm. (B and C) Scratch wound healing assay using IEC monolayers. EVs and hrANXA1 were added to wounded IECs alone and in the presence of FPR1 antagonist, CsH (1 μM); FPR2/ALX antagonist, WRW4 (10 μM); and other conditions, as indicated. Wound widths were determined at time 0 and 24 hours (n = 5, mean ± SEM) (original magnification, ×10). (D) Scratch wound healing assay using IEC monolayers. EVs were added to wounded IECs alone and in the presence of mouse monoclonal ANXA1 inhibitory antibody (250 μg/ml) or control IgG antibody (250 μg/ml). The experiments in C and D were repeated 3 times, and results of one representative experiment performed with 5 parallel samples are shown (mean ± SEM). ***P < 0.0001 compared with control; ###P < 0.0001 compared with EVs. (E and F) IECs were incubated with EVs for 15 minutes, and ROS generation was detected by confocal microscopy using the fluorescent Hydro-Cy3 dye (15 μM). Scale bar: 40 μm. Summarized data for Hydro-Cy3 fluorescence intensity are presented in the graph (mean ± SEM, *P = 0.0002 vs. control, n = 3). Confocal micrographs are representative of 3 independent experiments. All the results in this figure are representative of at least 3 independent experiments. Statistical comparisons were performed by ANOVA with Tukey’s multiple comparison post-test for C and D and 2-tailed Student’s t test for F. RFU, relative fluorescent units.

