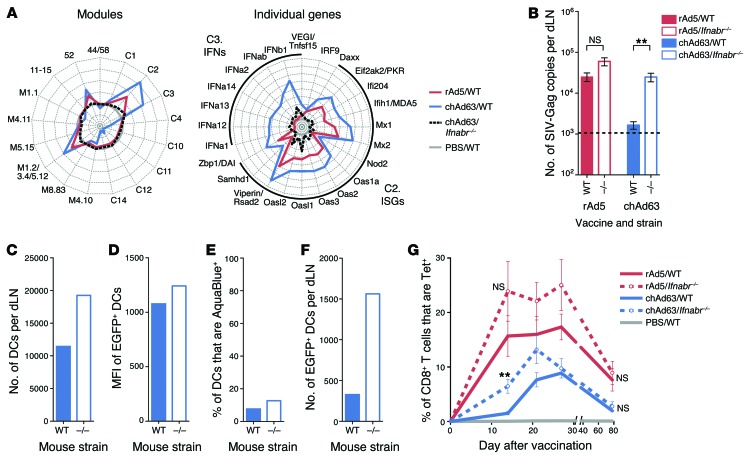
Figure 11. Effect of abrogating type I IFN signaling on Ag expression and CD8 T cell immunity.
(A) Radar plots of modules and individual genes within modules C2 and C3 24 hours after vaccination of WT or Ifnabr–/– mice with rAd5 or chAd63. Axes represent (left) maximum = +4, minimum = –2, circles = +4 (outside), +3, +2, +1, 0 (gray circle), –1 and –2, or (right) maximum = +8, minimum = –1, circles = +8 (outside), +7, +6, +5, +4, +3, +2, +1, 0 (gray circle), and –1 log2 fold change relative to PBS. (B) Ag expression at 40 hours after vaccination of WT or Ifnabr–/– mice with 1 × 10⁸ PU rAd5 or chAd63. (C) The number of total CD11c+ DCs per dLN, (D) the MFI of EGFP in EGFP+ DCs, (E) the frequency of nonviable CD11c+ DCs, and (F) the number of live EGFP+ CD11c+ DCs at 24 hours after vaccination of WT or Ifnabr–/– mice with 1 × 10¹⁰ PU of chAd63-EGFP. (G) Tetramer+ CD8+ T cell responses after vaccination of WT or Ifnabr–/– mice with 3 × 10⁷ PU rAd5 or chAd63. Error bars represent mean ± SEM. **P ≤ 0.01, Mann-Whitney test. The dashed line indicates the LOD. Data represent (B and G) 3 independent experiments with n = 3–6 or (C–F) 5 to 10 pooled dLNs per group.

