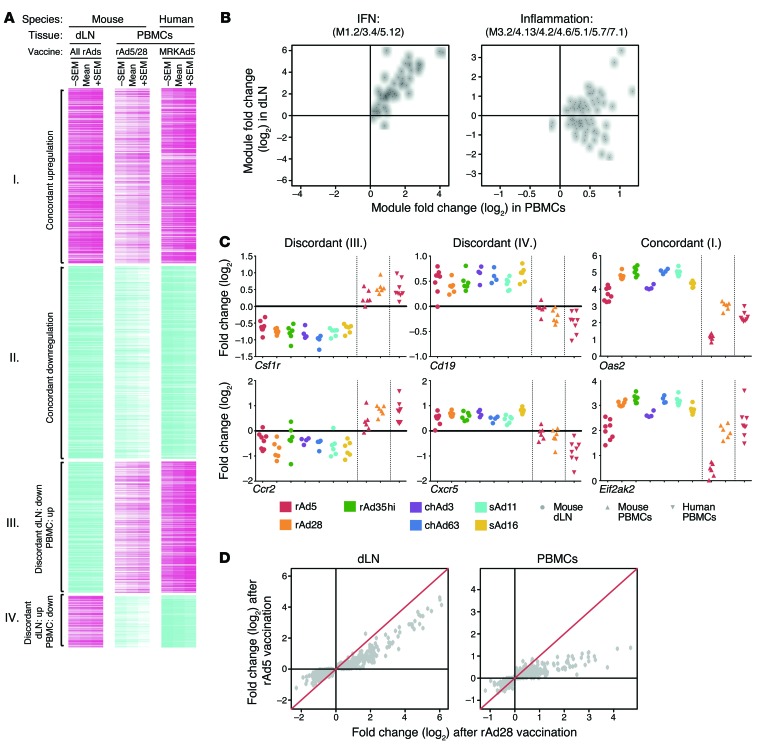
Figure 8. Comparison of local (dLNs) and systemic (PBMCs) innate gene activation.
(A) Heat map of 818 genes significantly responsive to rAd vaccination in dLNs or PBMCs, for mice or humans, at 24 hours after vaccination. Genes are clustered into concordantly (group I, 262 genes; group II, 285 genes) or discordantly (group III, 194 genes; group IV, 77 genes) regulated genes. Colors indicate scaled fold changes (magenta, upregulated; white, no change; cyan, downregulated) for the mean – SEM, mean, and mean + SEM response compared with the average response to PBS control (mice) or levels before vaccination. (B) Median expression fold changes across all vectors and species in dLNs plotted against the median expression fold changes in PBMCs for all genes comprising the IFN response module or inflammation module. Each point represents a unique gene. (C) Fold changes in gene expression as compared with PBS control mice for select genes that are discordantly (Csf1r and Ccr2 or Cd19 and Cxcr5) or concordantly (Oas2 and Eif2ak2) regulated. (D) Average gene expression fold changes (compared with PBS) induced by rAd5 are plotted against fold changes induced by rAd28 in dLNs or PBMC samples for all genes that were found to be concordantly regulated between the 2 tissues. Each point represents a unique gene. The red line indicates y = x.

