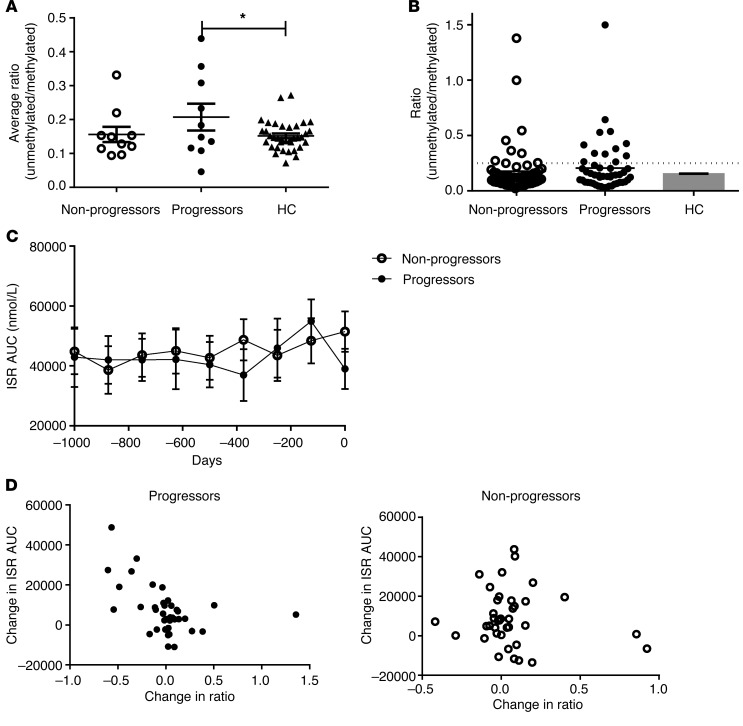
Figure 2. β Cell death in progressors and nonprogressors to T1D in the PTP study followed for long periods of time.
(A) Comparison of the average levels (mean ± SEM) of unmethylated INS DNA (i.e., ratio of unmethylated/methylated INS DNA) in the at-risk progressors, nonprogressors, and healthy control subjects (HC) (P = 0.048, ANOVA; *P < 0.05, Bonferroni multiple comparison test). (B) All of the individual ratio measurements are shown for the at-risk progressors (n = 10, 49 measurements) and nonprogressors (n = 10, 56 measurements) and were compared with the average levels (n = 32, 62 measurements). Six measurements (of a total of 105) were unobtainable for technical reasons. The dashed line represents the mean + 2 SD of the nondiabetic control subjects. (C) The ISR AUC for the progressors and nonprogressors at the study visits over the observation period prior to the diagnosis of T1D in the progressors or the last study visit in the nonprogressors. The least-square mean ± SEM from the repeated-measures ANOVA is shown. Neither the 2 curves nor the individual time points differ significantly. (D) The relationship between the change in the ratio and the change in the ISR AUC (from the first study visit) is shown for the progressors and nonprogressors (progressors: Pearson correlation coefficient, r = –0.475, P = 0.0026; nonprogressors: P = NS). All of the data points are shown.

