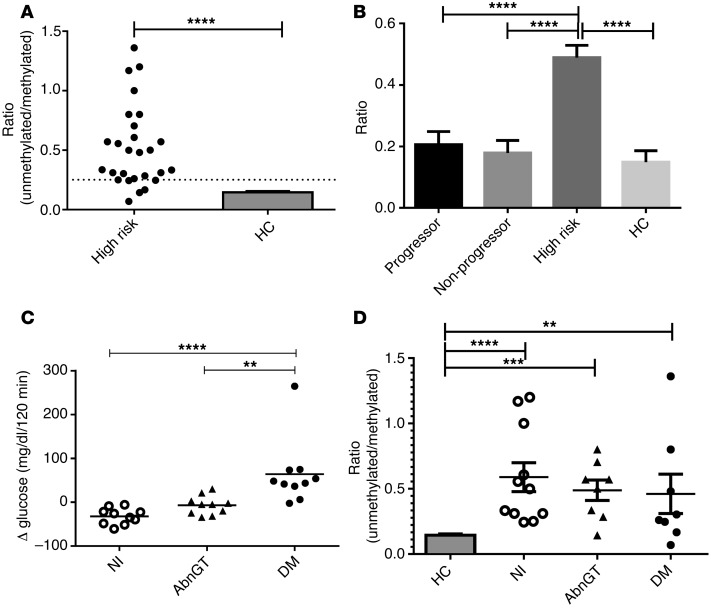
Figure 4. β Cell death and glucose tolerance in high-risk individuals.
(A) The level of unmethylated INS DNA to methylated INS DNA measured by ddPCR in serum samples from the first visit (n = 27; results from 3 samples were unavailable for technical reasons) was compared with age-matched nondiabetic control subjects (HC) (****P < 0.0001, Student’s t test). The dashed line represents the mean + 2 SD of the nondiabetic control subjects (n = 32) is shown. The dashed line represents the mean + 2 SD of the nondiabetic control subjects. (B) Comparison of ratios in high-risk subjects, progressors, and nonprogressors from the PTP study and healthy control subjects. Data shown are the least squares (mean ± SEM) from the mixed model (using ID as a class variable). Ratios were higher in the high-risk group compared with the others (P < 0.0001, ANOVA; ****P < 0.0001). (C) Change in glucose AUC during OGTTs performed on 2 visits in high-risk participants. The second test was performed 94 ± 15 days after the first. Groups were designated by the outcome of the OGTT at the second visit. One-third of subjects had a normal glucose tolerance test when they returned (Nl), one-third repeated the finding of dysglycemia (AbnGT), and one-third showed a diabetic glucose tolerance test (DM). Change in glucose AUC during the 2-hour OGTT is shown (n = 10 each, P = 0.0002, ANOVA; **P < 0.01, ****P < 0.0001, Bonferroni multiple comparison test). (D) Ratios at the time of the first visit are shown for those who returned with a normal (n = 10), an abnormal (n = 8), and a diabetic (n = 9) OGTT and compared with the ratios in controls (mean + SEM; **P < 0.01, ***P < 0.001, ****P < 0.0001 vs. controls, Bonferroni multiple comparison test and ANOVA). Ratios were elevated in each subgroup compared with controls but were not significantly different between groups.

