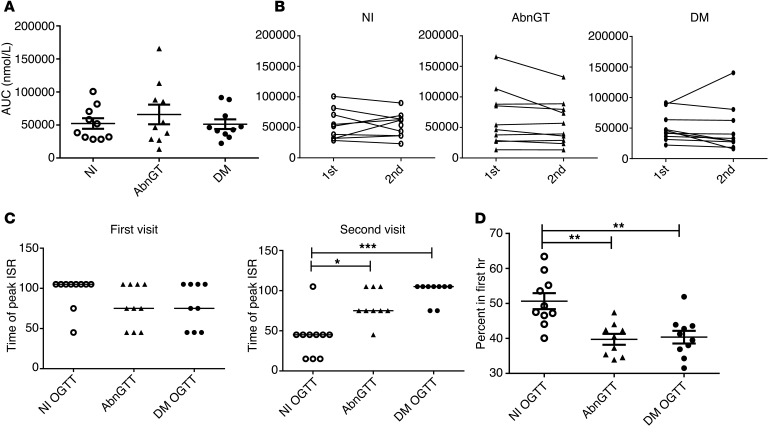
Figure 5. Insulin secretion during the repeat OGTTs in individuals at high risk for T1D.
(A) The insulin secretory AUC (n = 10 each, mean ± SEM) and (B) change in the AUC (second visit to first visit) are shown for each subgroup. There was not a significant change in the ISR AUC between the 2 visits. (C) The time of the peak rate of insulin secretion (ISR) during the 2-hour OGTT is shown for the first and second visits for the 3 subgroups of high-risk subjects. The time of peak insulin secretion was not significantly different at the first visit, at a time when all participants had an abnormal OGTT. Those who returned with normal glucose tolerance had an earlier time of peak insulin secretion when they returned (the lines represent median values, P = 0.0004, Kruskal-Wallis, overall group comparison; *P < 0.05, ***P < 0.001, Dunn’s multiple comparison test). (D) The percentage of total insulin secreted within the first hour of the second OGTT is shown. The high-risk subjects who returned with normal OGTT secreted a significantly greater proportion of insulin in the first hour compared with those who returned with an abnormal OGTT or diabetic OGTT (P = 0.0005, ANOVA; **P < 0.01, Bonferroni multiple comparisons test) (mean ± SEM).

