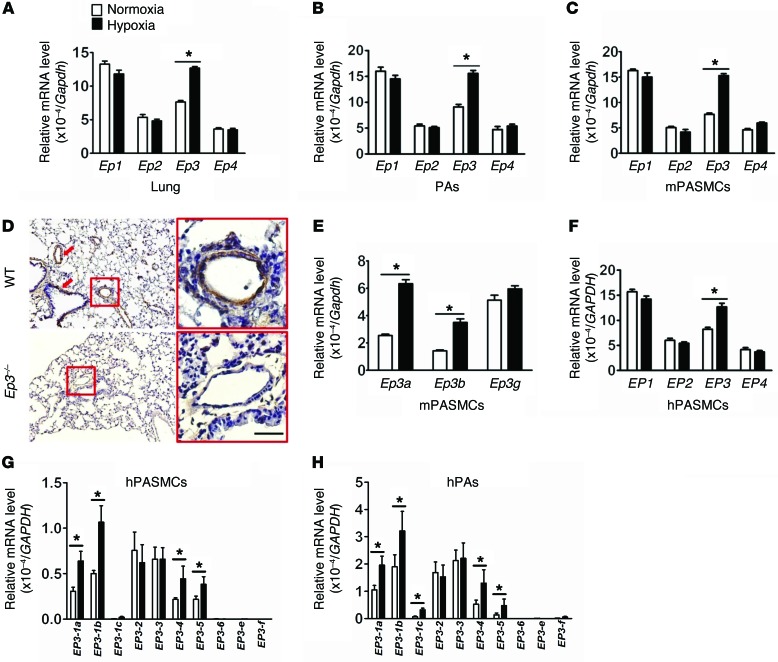
Figure 1. EP3 expression is upregulated in PASMCs in response to hypoxia.
(A) Relative mRNA levels of Ep1–4 in lung tissues from mice exposed to chronic hypoxia (n = 6). (B) Relative mRNA levels of Ep1–4 in PAs of hypoxia-treated mice (n = 6). (C) Relative mRNA levels of Ep1–4 in primary mPASMCs exposed to 1% O2 (n = 6). (D) Ep3 in situ hybridization in lung tissues from WT and Ep3–/– mice. Red arrows indicate strong staining. Scale bar: 20 μm (E) Relative mRNA levels of Ep3 isoforms in mPASMCs treated with normoxia or hypoxia (n = 6). (F) Relative mRNA levels of EP1–4 in primary hPASMCs exposed to 1% O2 (n = 6). *P < 0.05 versus normoxia. (G) Relative mRNA levels of EP3 isoforms in hPASMCs exposed to hypoxia. (H) Relative mRNA levels of EP3 isoforms in human PAs exposed to hypoxia. hPASMCs and human PAs in culture were exposed to 1% O2 for 24 hours before subjection to real-time quantitative RT-PCR analysis (n = 6 per group). *P < 0.05 versus normoxia by 2-tailed Student’s t test.

