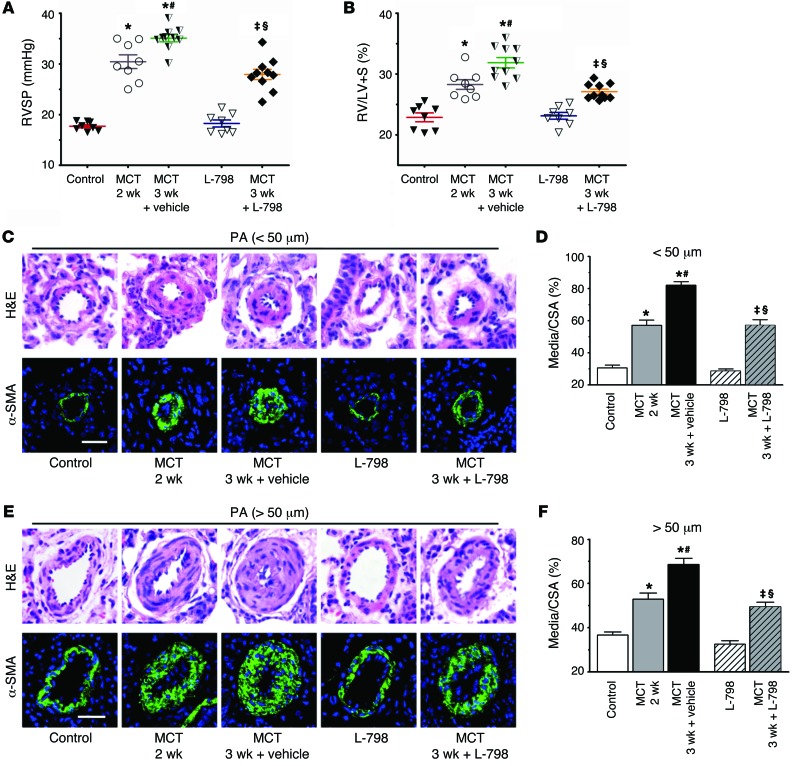
Figure 4. Inhibition of EP3 alleviates progression of MCT-induced PAH in rats.
(A and B) Effect of L-798106 administration on RVSP and RV/LV+S of MCT-induced PAH rats. (C) Representative images of H&E staining and α-SMA (green) immunostaining of PAs (20–50 μm in diameter). (D) Quantification of vascular medial thickness for images in C. (E) Representative images of H&E staining and α-SMA immunostaining of PAs (51–100 μm in diameter). (F) Quantification of vascular medial thickness for images in E. Scale bars: 20 μm. n = 8–10/group. *P < 0.05 versus control; #P < 0.05 versus MCT treatment after 2 weeks; ‡P < 0.05 versus L-798106; §P < 0.05 versus MCT treatment for 3 weeks plus vehicle. Data were calculated by 2-tailed Student’s t test or 1-way ANOVA with Bonferroni’s post-hoc analysis as appropriate. L-798, L-798106.

