Figure 1.
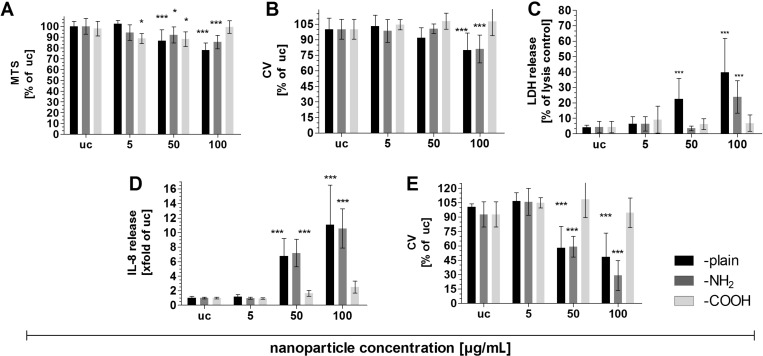
Comparison of cytotoxic effects on A549 after 4 h stimulation with aSNPs displaying different surfaces (–plain, –NH2, –COOH; 5–100 µg/mL, untreated control (uc)). A: Cell viability (mitochondrial activity, MTS, % of untreated control (uc)); B: cell viability (crystal violet staining of nuclei, cell loss measurement, % of uc); C: LDH release (membrane integrity, % of lysis control; D: IL-8 release after 4 h stimulation with 20 h further cultivation in fresh cell culture medium; E: cell viability (crystal violet, cell loss measurement) correlated to IL-8 (after 4 h stimulation with 20 h further cultivation in fresh cell culture medium). Data are depicted as means ± S.D. of 3 independent experiments with n = 3. For statistical analysis two-way ANOVA with Bonferroni’s post test was conducted. *P < 0.05, **P < 0.01 and ***P < 0.001 compared to the untreated control.

