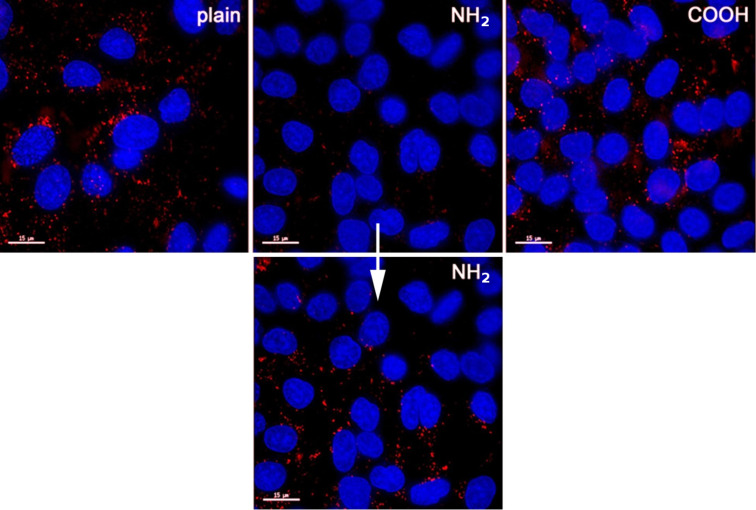
Figure 2.
Cellular uptake of aSNPs with different surfaces in A549 (–plain, –NH2, –COOH; 50 µg/mL). The cells clearly internalized all three aSNPs after an incubation time of 4 h in serum-free medium. An approximate quantification of cellular uptake via fluorescence intensity measurement of the images could not be conducted due to the varying fluorescence intensities of the aSNP labeling itself. Comparing all three aSNPs using same intensity scale, a very low signal is observed for aSNP–NH2. However, after upscaling the intensity individually, a clear uptake is also observed for aSNP–NH2. Images were taken by a wide field fluorescence microscope (Applied Precision, DeltaVision), aSNP are displayed in red (496 nm), nuclei are stained with Hoechst 33433, scale bar 15 µm.

