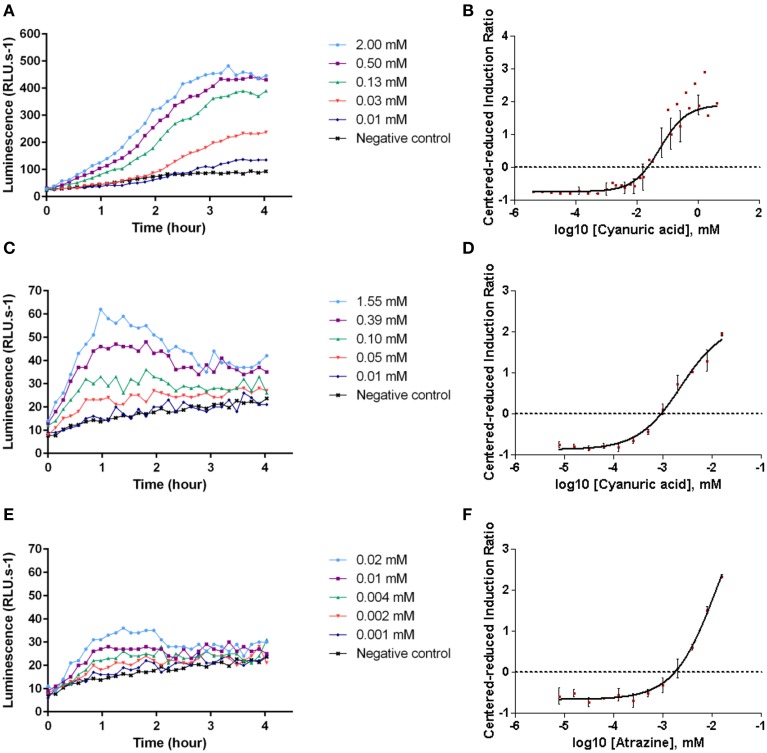
Figure 2.
Example of the kinetic of bacterial bioluminescence production. E. coli SM003 strain in the presence of cyanuric acid (A), E. coli SM004 strain in the presence of cyanuric acid (C) or atrazine (E). Modeled curves of centered-reduced induction ratio for E. coli SM003 at an exposure time of 2 h 30 min in the presence of cyanuric acid (B), and E. coli SM004 at an exposure time of 1 h in the presence of cyanuric acid (D) or atrazine (F). Bioluminescence measurements and induction ratio are calculated from duplicate of three independent experiments.

