Figure 3.
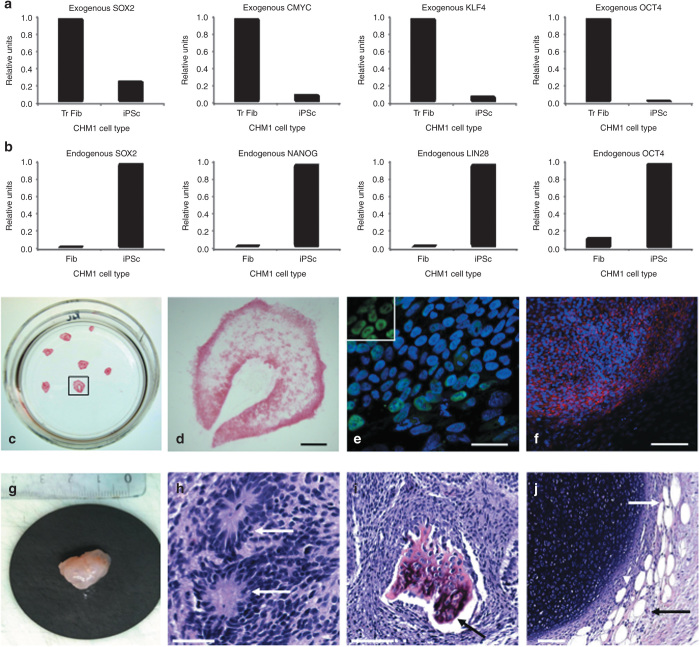
Characterization of CHM1 iPSCs. (a) Downregulation of the expression of the pluripotency genes delivered by the lentiviral vectors in iPSCs, compared with the expression in transduced fibroblasts (Tr Fib), as detected by q-PCR analysis. (b) Activation of the host’s endogenous pluripotency genes in iPSCs, as compared with fibroblasts (Fib), as shown by q-PCR analysis. (c) Expression of the pluripotency marker alkaline phosphatase by cell staining. (d) Magnification of the colony boxed in c. Bar = 500 µm. (e) Expression of the nuclear pluripotency marker NANOG (in green), as shown by immunofluorescence studies and merged with a Hoechst staining of the nuclei (in blue). Bar = 50 µm. Inset, nuclear expression of NANOG exclusively. (f) Expression of the pluripotency marker SSEA3 (in red) merged with Hoechst staining of the nuclei. Bar = 200 µm. Subcutaneous injection of CHM1 iPSCs into immunodeficient mice results in the formation of (g) teratomas that contain derivatives of the three germ lines: (h) neuroblastic rosettes (arrows) that are ectodermal in origin (bar = 50 µm); (i) osteocytes (arrow) that are mesodermal in origin (bar = 100 µm), and (j) adipose cells (arrows) that are endodermal in origin (bar = 100 µm). iPSC, induced pluripotent stem cell; OCT4, octamer binding transcription factor 4; SOX2, sex determining region Y-box 2.

