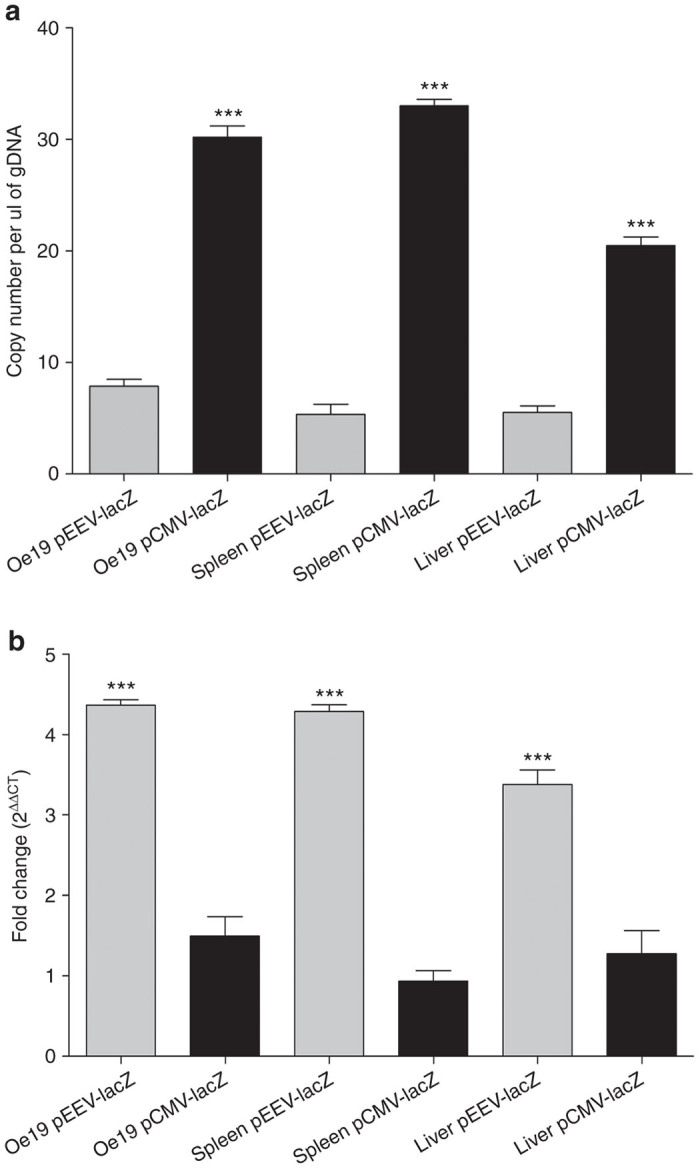
Figure 2.

β-galactosidase expression in murine tissue. (a) Copy numbers of lacZ transgene ascertained by quantitative polymerase chain reaction (PCR) in murine tissue. Bar graph showing absolute copy number of the lacz transgene per nanogram of genomic DNA 2 days after electroporation obtained from MF1-nu/nu mouse tissue. All gDNA samples were normalized to 100 ng of DNA prior to PCR. Each individual sample was analyzed in triplicate for each quantiative PCR (qPCR). qPCR values are means ± standard error of the mean (SEM) of triplicate measurements. A comparison of enhanced expression vector (pEEV) (light gray bars) and pCMV (dark gray bars) samples were performed. ***P < 0.0001. (b) Evaluation of lacZ mRNA transcript expression by qRT-PCR in murine tissue. Bar graph presenting the relative expression of the lacZ mRNA 2 days after electroporation obtained from MF1-nu/nu mouse tissue. All qPCR data were normalized using 18S RNA as reference gene. Relative expression levels are plotted as means ± SEM of triplicate measurements. pEEV (light gray bars) and pCMV (dark gray bars). pEEV lacZ expressed was significantly higher than pCMV lacZ. ***P < 0.0001.
