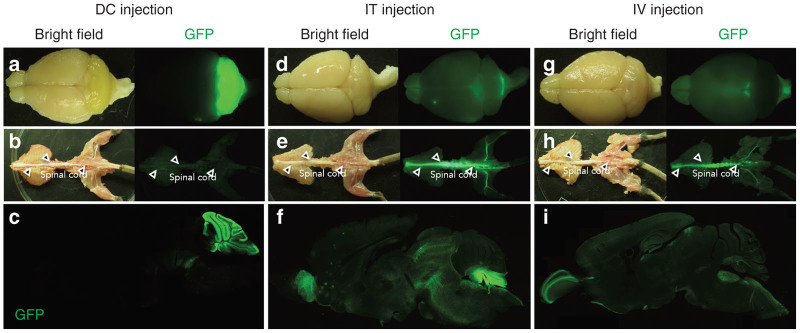
Figure 2.

GFP expression profiles in the CNS resulting from the three different routes of administration of the ssAAV9 vector. Four-week-old mice received DC or IT injections of ssAAV9 vectors, while P1 mice received IV injections. The mice were sacrificed 2 weeks (DC and IT injections) or 4 weeks (IV injection) after the virus injection. Native GFP-fluorescent and bright field images of the brains and spinal cords are presented. (a–c) Mice that received DC injections. (d–f) Mice that received IT injections. (g–i) Mice that received IV injections. In each set of images, the upper, middle and lower images show the whole brains, spinal cords, and sagittal sections of the brain, respectively. The spinal cords are indicated by open arrowheads.
