
Figure 8.
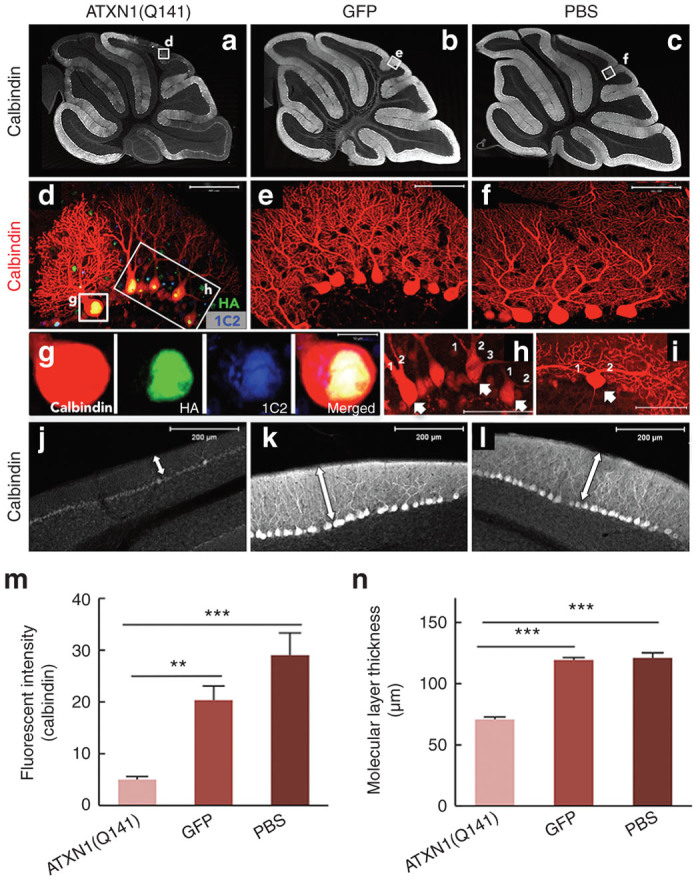
Neurodegenerative changes in the cerebellar cortex following the DC injection of ssAAV9 vectors expressing mutant ATXN1. (a–c) Sagittal section of the cerebellum of mice that received DC injection of (a) ssAAV9 vectors expressing ATXN1(Q141), (b) ssAAV9 expressing GFP or only (c) PBS. The sections were immunolabeled for calbindin. Note that calbindin immunoreactivity was diffusely decreased only in a section expressing mutant ATXN1(Q141), which is a finding characteristic of PC degeneration. (d–f) Impairment of PC dendrites after DC injection of the ssAAV9 vectors expressing mutant ATXN1. Cerebellar sections from the mice treated with the (d) ssAAV9 vectors expressing mutant ATXN1(Q141) were triple immunolabeled for calbindin (red), HA-tagged with mutant ATXN1 (green) and abnormally expanded polyglutamine (blue). Sections from the mice treated with (f) PBS or (e) ssAAV9 vectors expressing GFP were immunolabeled for calbindin. (d) PCs expressing mutant ATXN1, but not (e) PCs expressing GFP or (f) PBS-treated PCs, show aberrant dendritic morphology, such as two or more primary dendrites and markedly reduced branching. (g) An enlarged image of the PC soma in d shows nuclear localization of the mutant ATXN1 immunostained for HA, which was coimmunolabeled for abnormally expanded polyglutamine (1C2 immunostaining). (h,i) Aberrant multiple primary dendrites of PCs expressing mutant ATXN1(Q141). Arrows indicate PCs with double or triple primary dendrites as numbering. (j–l) Significant decrease in the immunoreactivity for calbindin and thickness of the molecular layer from the mice that received DC injection of the ssAAV9 vectors expressing ATXN1(Q141). Bidirectional arrows show the molecular layer of the lobule 6. (m) Significant decrease in the fluorescent intensity of calbindin in PCs by expression of mutant ATXN1. Graph shows the fluorescent intensity of calbindin, which were measured in the molecular and PC layers of the cerebellar lobule 6 from mice treated with ssAAV9 vectors expressing ATXN1(Q141), (b) ssAAV9 expressing GFP or only (c) PBS. (n) Quantitative analysis of the molecular layer thickness. The molecular layer thickness was measured as previously described by Furrer et al.21 at every 200 µm in lobule 6 using three to four sections/mouse (six mice in each group). The molecular layer thickness was significantly decreased only in the mice treated with the ssAAV9 vectors expressing mutant ATXN1. Scale bars, (d–f,h,j) 50 µm and (j–l) 200 µm. Asterisks indicate statistically significant differences determined by one-way analysis of variance followed by Tukey’s post hoc test, **P < 0.01, ***P < 0.001.