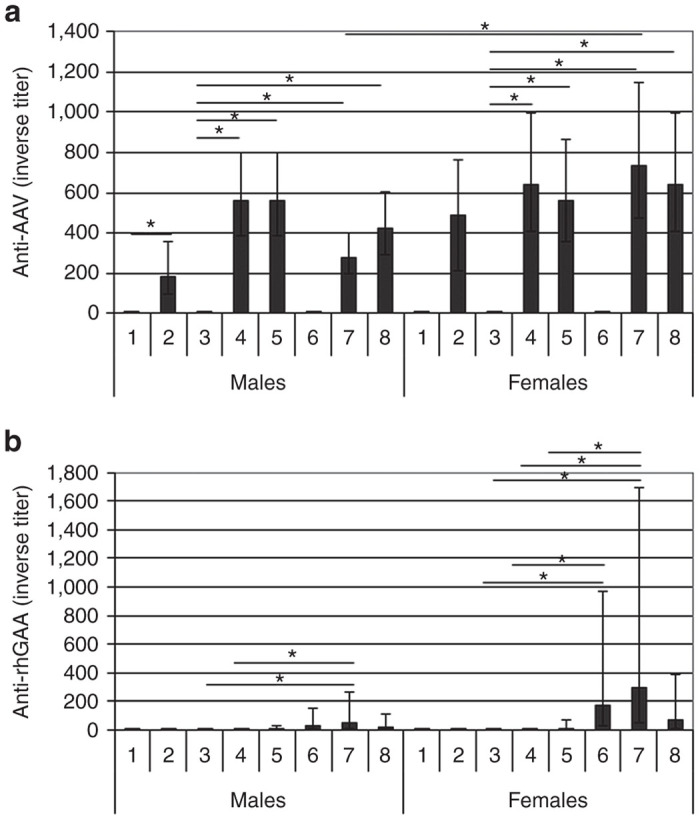
Figure 6.

Antibody responses. Immunoglobulin G (IgG) against (a) AAV. (b) GAA. The data were presented as geometric mean (n = 5). The positive error bar represents the upper limit of 95% confidence interval, and the negative error bar the lower limit of 95% confidence interval. Group number indicated on the horizontal axes. Group: 1, vehicle; 2, vector; 3, vehicle; 4, vector; 5, vector, ERT ×2; 6, ERT ×2; 7, vector, ERT ×8; 8, ERT, vector, ERT ×5. ERT, enzyme replacement treatment.
