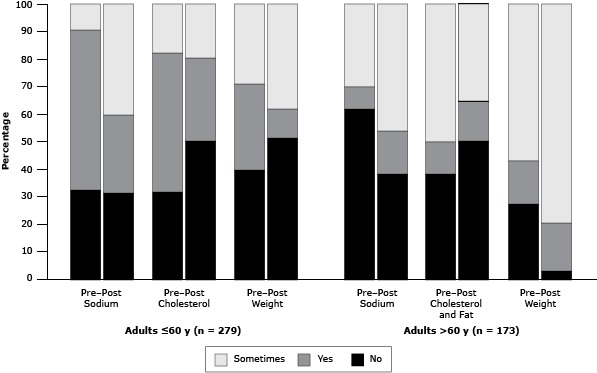
Figure 1.

Distribution of responses for heart-healthy habits among adult participants at baseline (pretest) and 12-week postintervention follow-up (posttest) in the Salud para su Corazón Mexican pilot study. Responses were positive if the respondent answered yes for improved (less salt, saturated fat, and cholesterol consumption, more weight control or weight reduction) or “sometimes” improved on some days but not all the time. Negative responses if the respondent answered “no” meaning the positive health behavior is the same or decreasing (such as more or same amount of salt intake or cholesterol and fat consumption, less weight control or weight gain).
| Age Group/Habit | Pretest, % |
P Valuea | Posttest, % |
P Valuea | ||||
|---|---|---|---|---|---|---|---|---|
| Yes | No | Sometimes | Yes | No | Sometimes | |||
| Adults ≤60 y (n = 279) | ||||||||
| Sodium intake | 58.4 | 32.3 | 9.3 | .001 | 28.3 | 31.2 | 40.5 | <.001 |
| Cholesterol and fat intake | 50.5 | 31.5 | 17.9 | .001 | 30.1 | 50.2 | 19.7 | .001 |
| Weight | 31.2 | 39.8 | 29.0 | .002 | 10.4 | 51.3 | 38.4 | <.001 |
| Adults >60 y (n = 173) | ||||||||
| Sodium intake | 8.1 | 61.8 | 30.1 | .001 | 15.6 | 38.2 | 46.2 | .001 |
| Cholesterol and fat intake | 11.6 | 38.2 | 50.3 | .24 | 14.5 | 50.3 | 35.3 | .21 |
| Weight | 15.6 | 27.2 | 57.2 | .38 | 17.3 | 2.9 | 79.8 | .28 |
