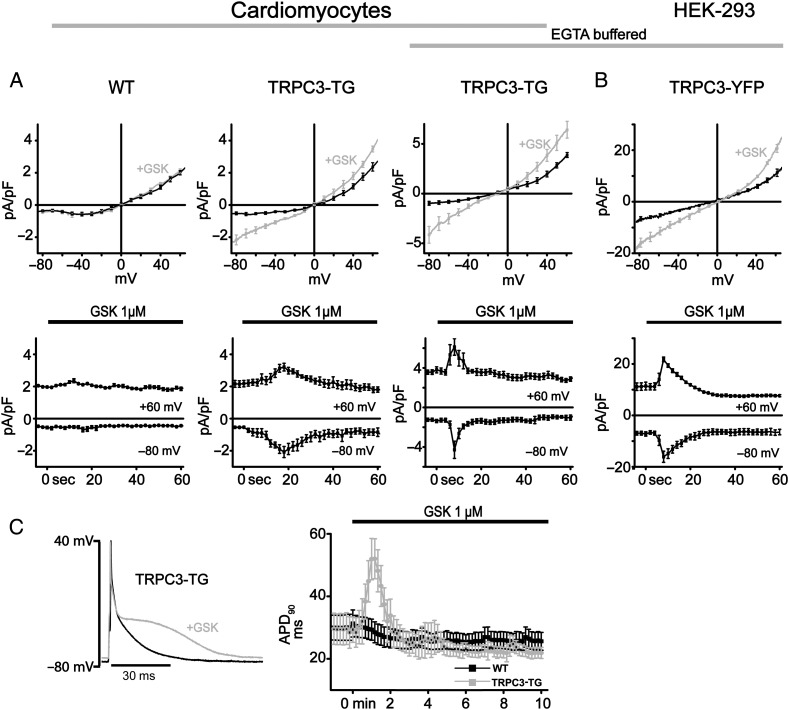
Figure 1.
Activation of TRPC3 currents in cardiomyocytes and HEK293 cells by GSK1702934A. Membrane currents and action potentials were recorded with standard whole-cell patch-clamp technique (for details, see Supplementary material online). Current–voltage (I–V) relations were obtained by applying a descending voltage ramp (+90 mV to −120 mV for 2 s) to eliminate voltage-gated Na+ and Ca2+ currents. (A) Average (upper panel) and time courses of currents at +60 mV and −80 mV (lower panel) in the absence and presence of GSK1702934A (1 µM; GSK). Voltage dependence of responses to GSK (upper panel) corresponding to peak of activation (grey) in comparison to baseline (control; black) for wild-type (WT; A, left, n = 7; N = 3), TRPC3-TG myocytes (A, centre, n = 8; N = 3), TRPC3-TG myocytes loaded with 11 mM EGTA to buffer to diastolic levels (A, right, n = 8; N = 3; EGTA buffered) and HEK293 cells overexpressing TRPC3 (B, n = 5) with buffered (3 mM EGTA; EGTA buffered). (C) Left: representative action potential (AP) recordings from a TRPC3-TG ventricular myocyte before (black line) and during administration of GSK (1 µM, grey line). Without intracellular Ca2+ buffer, GSK prolongs late repolarization up to 1.5-fold in TRPC3-TG but not in WT cardiomyocytes. Right: time course of APD90 recorded from wild-type (WT) and transgenic (TRPC3-TG) ventricular myocytes in response to 1 µM GSK [n = 10; N = 4 (WT), N = 3 (TG)].

