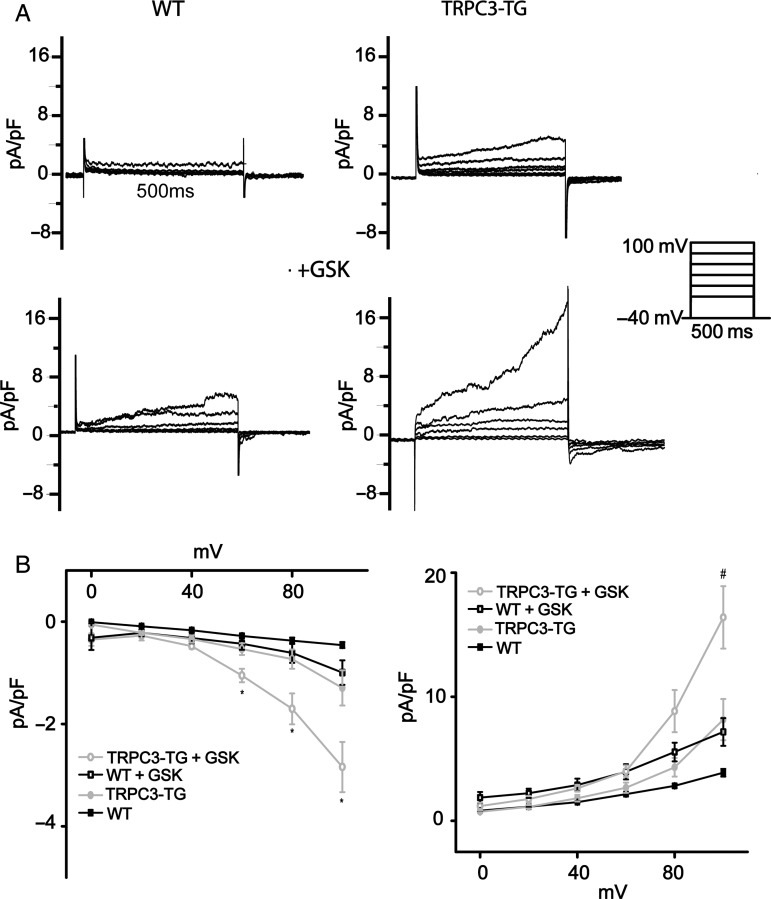
Figure 4.
Cardiac TRPC3 activity modulates NCX function. NCX currents were recorded by applying depolarizing voltage steps (500 ms) from a holding potential of −40 mV and quantified as the Ni+-sensitive current components at the end of the 500 ms depolarization steps (NCX reverse mode) and 20 ms after repolarization to −40 mV (forward mode).34,35 (A) Representative Ni+-sensitive outward currents recorded during depolarizing steps as well as subsequent tail currents upon repolarization to −40 mV for 4.5 s are shown for WT cardiomyocytes (left) and TG cardiomyocytes (right) in the absence [n = 8; N = 3 (WT); n = 9; N = 3 (TG)] (top) and presence (bottom) of 1 µM GSK [n = 8; N = 3 (WT); n = 12; N = 3 (TG)]; SR function was eliminated by thapsigargin (3 µM) and l-type Ca2+ channels were blocked by nitrendipine (10 µM). (B) Mean (±SEM) I/V plots of Ni+-sensitive peak currents. Left: tail inward currents representing NCX forward-mode activity in WT and TRPC3-TG cells and in the absence or presence of 1 µM GSK. Tail currents represent Ni+-sensitive peak inward currents at 20 ms after repolarization to −40 mV with steady-state holding current subtracted. Right: mean (±SEM) peak outward currents recorded from WT and TRPC3-TG cells in the presence and absence of 1 µM GSK. * indicates significant difference (P < 0.05) to WT, WT + GSK, and TRPC3-TG; sharp (#) significant difference (P < 0.05) to WT + GSK cells. Statistical significance analysed by two-way Anova followed by Tukey's post hoc tests.

