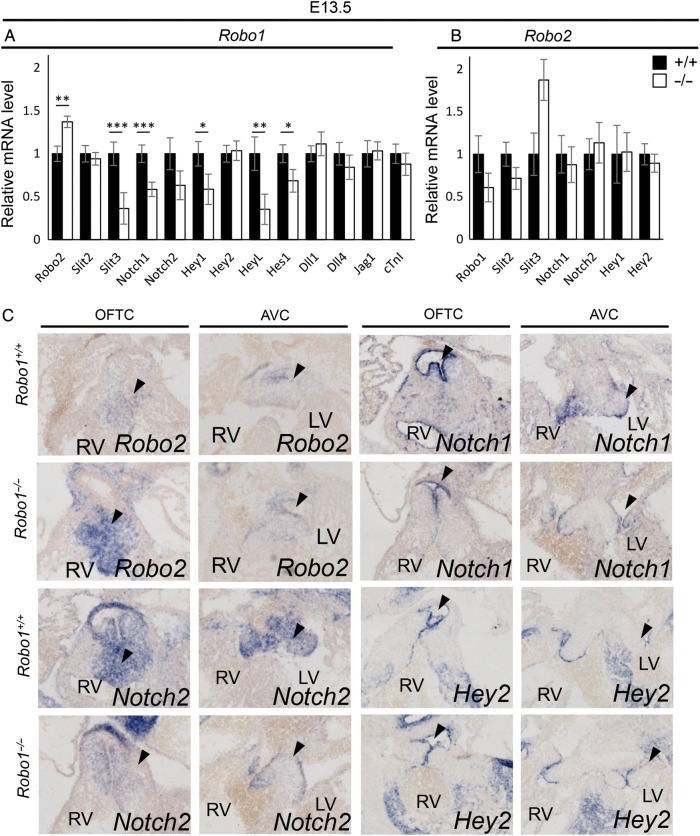
Figure 6.
Down-regulation of Notch and downstream targets in the absence of Robo1. (A and B) Quantitative PCR on E13.5 Robo1+/+ and Robo1−/− (A, n = 6) and Robo2+/+ and Robo2−/− (B, n = 6) mRNA isolated from outflow tract with atrioventricular canal regions. All mutant levels visualized in relative levels to the wild-type expression set at 1. (A) Robo2, P = 0.007; Slit2, P = 0.62; Slit3, P ≤ 0.001; Notch1, P ≤ 0.001; Notch2, P = 0.09; Hey1, P = 0.026; Hey2, P = 0.82; HeyL, P = 0.003; Hes1, P = 0.029; Dll1, P = 0.53; Dll4, P = 0.39; Jag1, P = 0.86; cTnI, P = 0.45. (B) Robo1, P = 0.13; Slit2, P = 0.11; Slit3, P = 0.09; Notch1, P = 0.67; Notch2, P = 0.68; Hey1, P = 0.95; Hey2, P = 0.51; Student's t-test. (C) In situ hybridization on E13.5 Robo1+/+ and Robo1−/− embryos for the indicated genes showing up-regulation of Robo2, down-regulation of Notch1 and Notch2, but not Hey2 in the absence of Robo1. Black arrow heads indicate the areas of differential expression in the cushions. n ≥ 3 embryos per gene. *P < 0.05, **P < 0.01 and ***P < 0.001. For abbreviations, see the legend of Figure 1. Scale bars depict 100 µm.

