Figure 3.
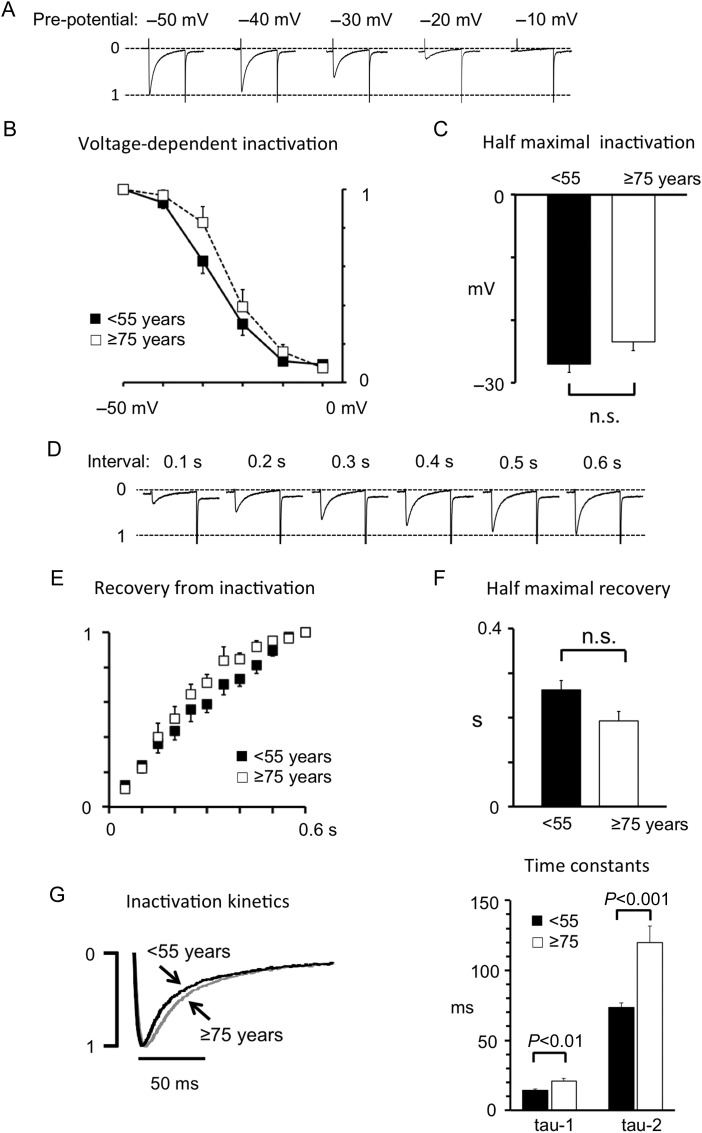
Effects of ageing on intrinsic L-type calcium channel properties. (A) Representative ICa traces obtained after a prepulse to different membrane potentials (given above traces). Current traces are normalized to the ICa amplitude at −50 mV. (B) Relationship between the prepulse potential and the ICa amplitude. (C) Bar diagram of the voltage for half-maximal ICa inactivation. Values were obtained by fitting data in (B) with a Boltzmann equation. (D) Representative ICa traces elicited at different times (given above traces) after the preceding stimulation pulse. (E) Relationship between pulse interval and the recovery of the ICa amplitude. Values were normalized to the ICa amplitude at 0.6 s. (F) Bar diagram of the time for half-maximal recovery of ICa. Values were obtained by fitting data in (E) with an exponentially decaying function. (G) Normalized ICa traces from a young and an old patient. Average fast (tau-1) and slow (tau-2) time constants are shown in the right panel. P-values for significant differences are indicated for corresponding bars. All values are from 21 young (<55) and 17 old (≥75) patients (n.s. indicates a non-significant difference).

