
. 2015 Mar 5;9:90. doi: 10.3389/fnhum.2015.00090
Copyright © 2015 Lecouvey, Quinette, Kalpouzos, Guillery-Girard, Bejanin, Gonneaud, Abbas, Viader, Eustache and Desgranges.
This is an open-access article distributed under the terms of the Creative Commons Attribution License (CC BY). The use, distribution and reproduction in other forums is permitted, provided the original author(s) or licensor are credited and that the original publication in this journal is cited, in accordance with accepted academic practice. No use, distribution or reproduction is permitted which does not comply with these terms.
Figure 2.
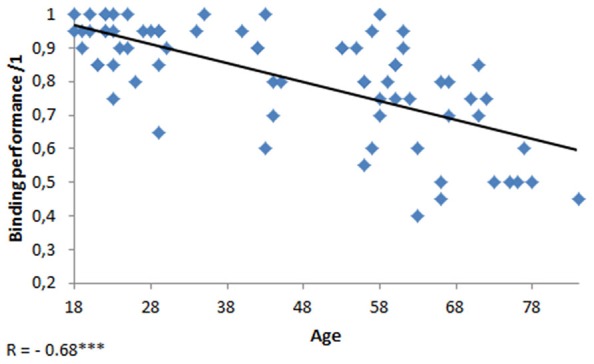
Scatterplot of the performance at the binding task as a function of age. ***p < 0.001.