
FIGURE 3.
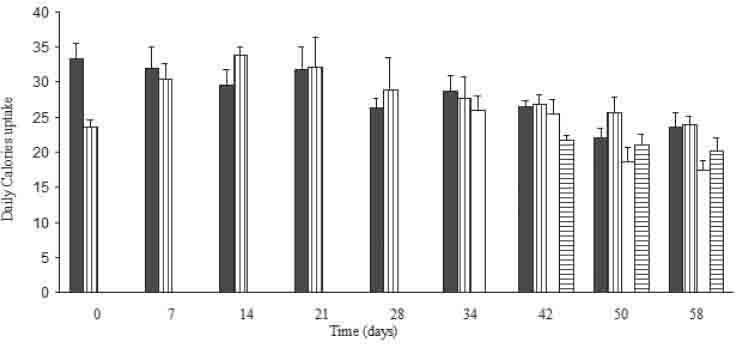
Food uptake in Kcal/day/100 g B.W for all the treated groups through out the treatment period. Results are expressed in mean± S.E.M. * Indicates statistical significance as compared to control (p<0.05). #indicates s (Nembutal tatistical significance as compared to H group (p<0.05). ☼ indicates statistical significance as compared to HG group (p<0.05). § indicates statistical significance as compared to G group (p<0.05).