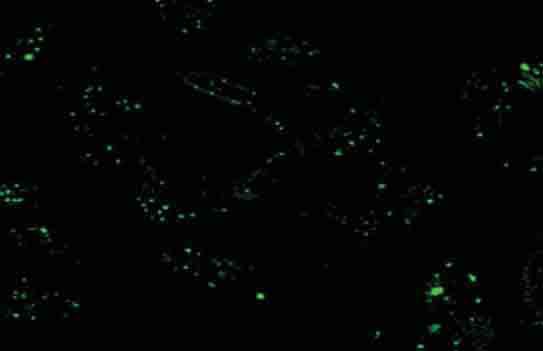
FIGURE 2.

Laser scanning confocal microscopy (LSCM) analysis of transfected HepG2/CDDP/2.0 cells. HepG2/CDDP/2.0 cells were transfected with control siRNA-F (90 nM) for 24h and subjected to LSCM analysis. The green dots represent the transfected siRNA (400× magnification).
