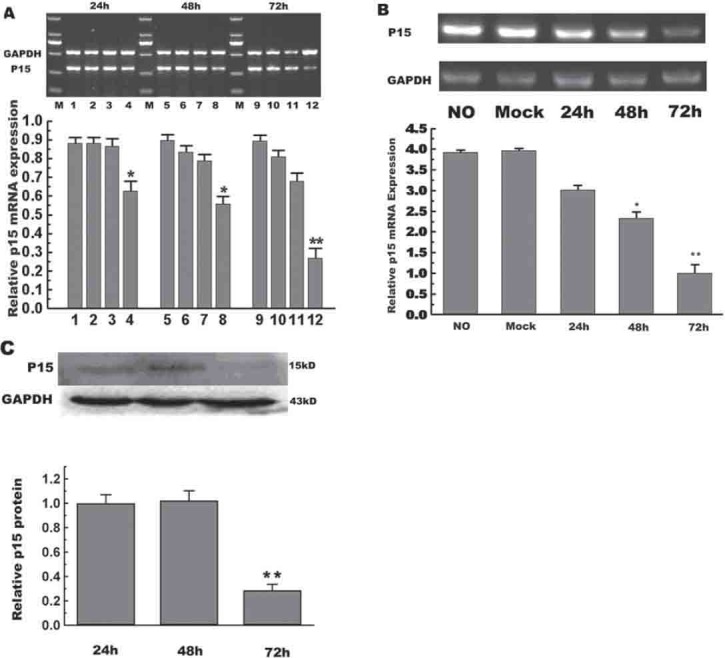
FIGURE 3.

Transfection with p15-specific siRNA inhibits the expression of p15 in HepG2/CDDP/2.0 cells. HepG2/CDDP/2.0 cells were transfected with different p15-specific siRNAs (Y1, Y2, and Y3) or control siRNA-F at a final concentration of 90 nM for the indicated periods. The relative levels of p15 mRNA expression to control GAPDH were determined by RT-PCR and Western blot assays. (A) RT-PCR analysis of p15 mRNA transcripts. 1, 5, and 9: Transfected with siRNA-F; 2, 6, and 10: Transfected with siRNA Y1; 3, 7, and 11: Transfected with siRNA Y2; 4, 8, and 12: Transfected with siRNA Y3. (B) RT-PCR analysis. HepG2/CDDP/2.0 cells were transfected with 90 nM of siRNA-F (mock) for 72 h or with siRNA Y3 for the indicated periods. (C) Western blot analysis: The relative levels of p15 protein were determined by Western blot assays. Data are expressed as representative images and mean ± SD of individual groups from three separate experiments.
