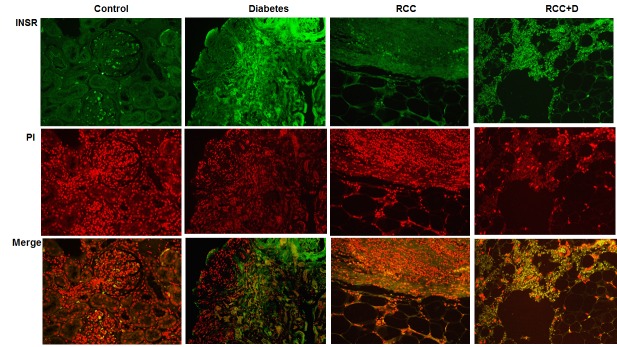
Figure 2. Immunostaining of INSR in kidney sections from control, diabetes, RCC, and RCC+diabetes.

FITC as green signals for INSR and propidium iodide (PI) red signals for nucleus showed the majority of staining of INSR in kidney sections of both diabetes and RCC+diabetes groups. Merge image showed the overlap of INSR with PI indicting strong staining of INSR in kidney sections from diabetes and RCC+D groups.
