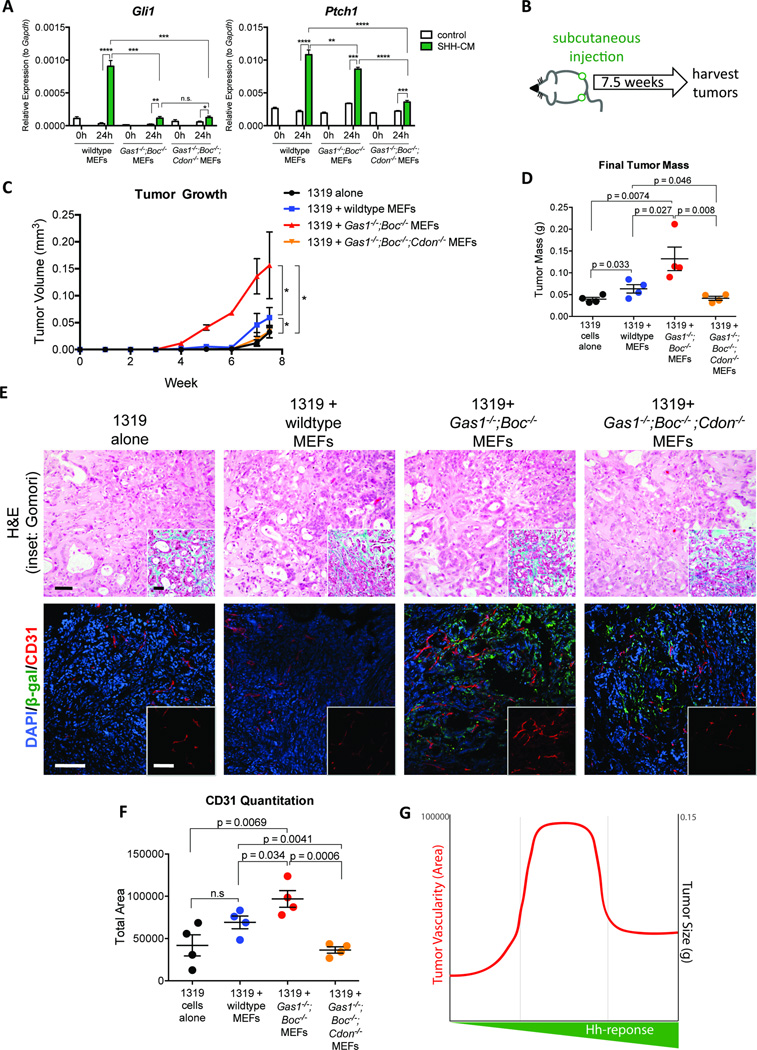
Figure 3. Dosage-dependant HH signaling differentially promotes pancreatic tumor growth.
(A) RT-qPCR analysis for Gli1 and Ptch1 in MEFs. (B) Schematic of subcutaneous tumor injection experiment. (C) Growth curve for subcutaneous tumors. (D) Quantitation of final tumor size. (E) Histopathological analysis of tumors following co-injection of 1319 cells with MEFs. Scale bar, 50µm, inset scale bar 50µm. H&E staining (top panels) and Gomori trichrome (inset, top panels). Antibody detection of β-gal (green) and CD31 (red; bottom panels). DAPI (blue) marks nuclei. Scale bar 50µm, inset scale bar 50µm. (F) Quantitation of CD31 staining. (G) Comparison of tumor size and vascularity between fibroblast lines.

