
FIGURE 3.
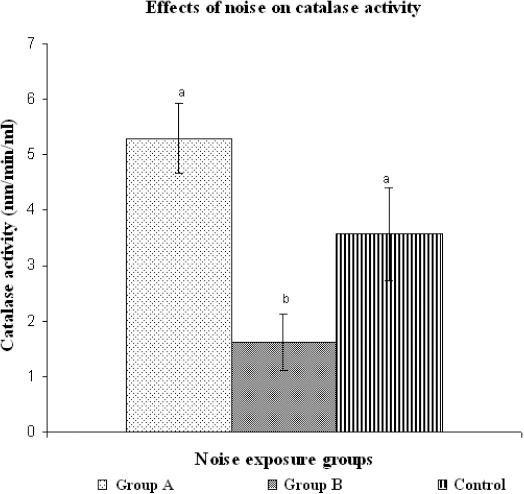
Comparison of catalase activity in different noise groups. Bars with different letters indicate significant difference among the groups (p=0.003, p< 0.05).
Official websites use .gov
A
.gov website belongs to an official
government organization in the United States.
Secure .gov websites use HTTPS
A lock (
) or https:// means you've safely
connected to the .gov website. Share sensitive
information only on official, secure websites.
Comparison of catalase activity in different noise groups. Bars with different letters indicate significant difference among the groups (p=0.003, p< 0.05).