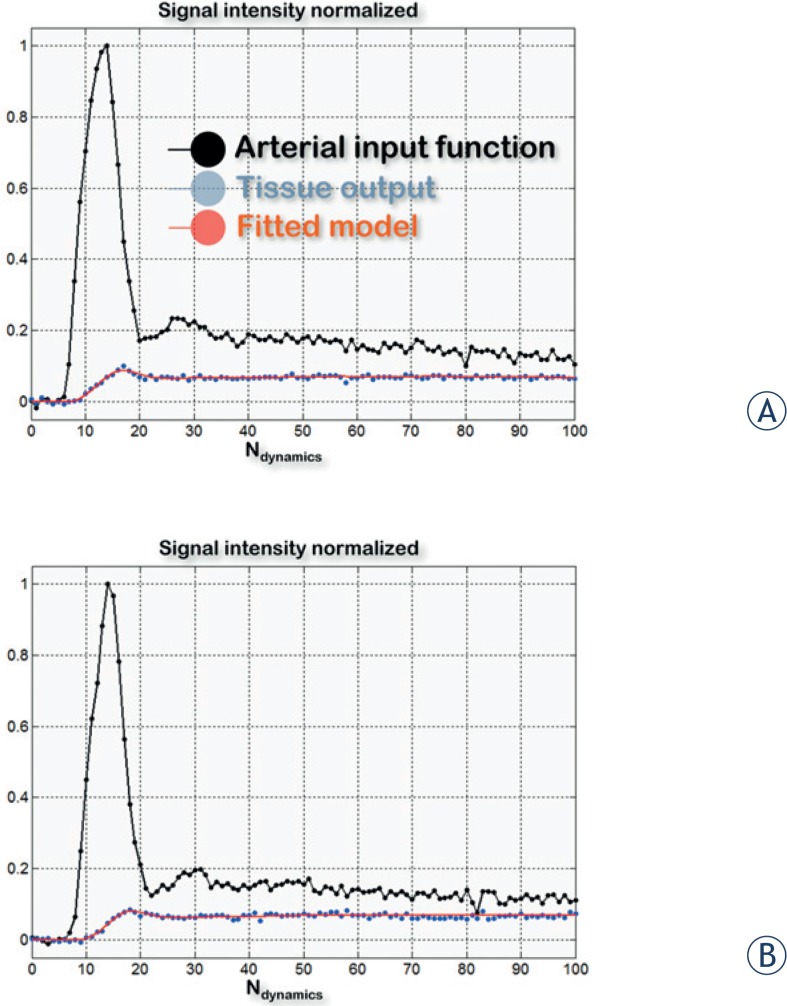
FIGURE 2.
Example of time intensity curves derived from the internal carotid and tumoral lesion before (A) and during treatment with cetuximab (B) in a patient with a squamous cell carcinoma of the head and neck. The quality of the fits of TICs using the Brix two-compartment kinetic model was found to be good (estimation of the root mean squared error of the regression averaged on the 14 normalized fits: εpre-treatment = 5%, εduring-treatment = 6%).

