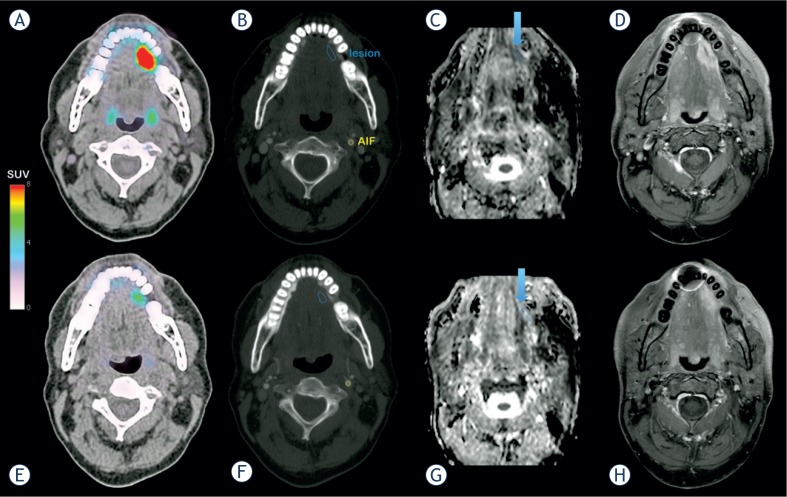
FIGURE 4.
A patient with squamous cell carcinoma of the head and neck. Before cetuximab treatment: (A) PET/CT fusion imaging showing the anatomical location of FDG uptake. (B) CT imaging with the regions of interest used for kinetic analysis. (C) ADC mapping derived from DW-MRI with a measured ADClesion = 1009 mm2.s−1 ± 123 mm2.s−1. (D) Spin Echo T1-weighted MR imaging with fast suppression technique (SPIR) after gadolinium injection (lesion long axis: 2.88 cm, lesion short axis: 1.52 cm). MRI examination was performed 6 days after PET/CT. During treatment with cetuximab: (E) PET/CT fusion showing imaging of the decrease of FDG uptake. (F) CT imaging with the regions of interest used for kinetic analysis. (G) ADC mapping derived from DW-MRI with an increased ADClesion = 1325 mm2.s−1 ± 192 mm2.s−1. (H) Spin Echo T1-weighted MR imaging with fast suppression technique (SPIR) after gadolinium injection (lesion long axis: 2.72 cm, lesion short axis: 1.12 cm). MRI and CT examinations were performed the same day.

