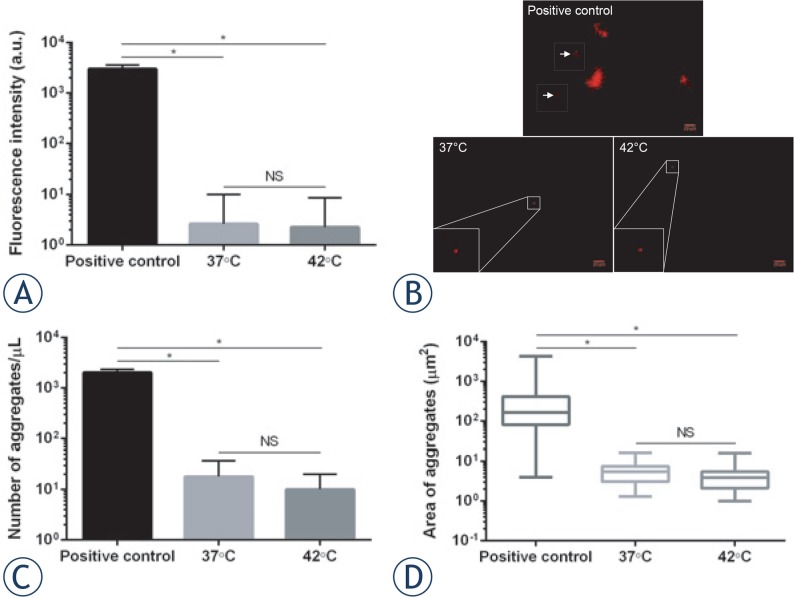
FIGURE 1.
Herceptin® stability. Immediately after Nile Red addition (100 μM), 0.8 mg/mL antibody solution was incubated at 37°C (native antibody), 42°C (heated antibody) and 90°C (positive control) for 1 h. Spectrofluorimetry was used for measuring total fluorescence signal (A), whereas fluorescence images were taken for observing Herceptin® aggregates (B). Representative images of antibody aggregates for each experimental condition are shown. Concentration (C) and area (D) of antibody aggregates are reported. Data expressed as mean ± SD was calculated from five independent experiments. Statistical analysis was performed using the non-parametric Mann-Whitney test. Significance was defined as p < 0.05 (NS, non-significant; *p < 0.05 compared to the positive condition).

