
FIGURE 3.
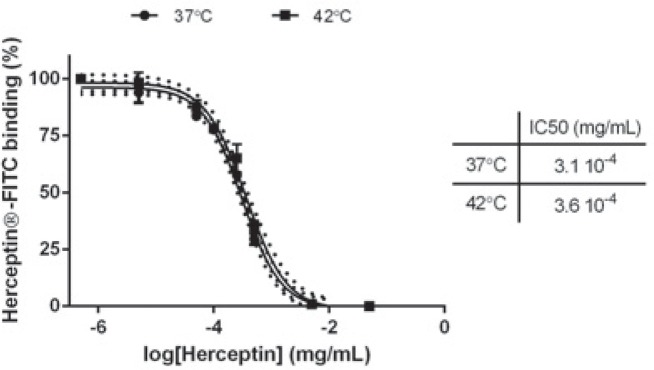
Binding affinity of Herceptin® to HER-2. BT-474 cells were first incubated with unconjugated Herceptin® (5 × 10⁻⁶ to 5 × 10⁻² mg/mL) and subsequently with FITC-Herceptin®. Fluorescence intensity on flow cytometry is plotted as a function of unlabeled Herceptin® concentration used for receptor saturation. Data expressed as mean ± SD calculated from three independent experiments and are fitted with Variable slope model (solid curve; confidence intervals, dotted curve) with a 95% confidence interval. Statistical analysis was performed using the non-parametric Mann-Whitney test. Significance was defined as p < 0.05 (NS, non-significant).